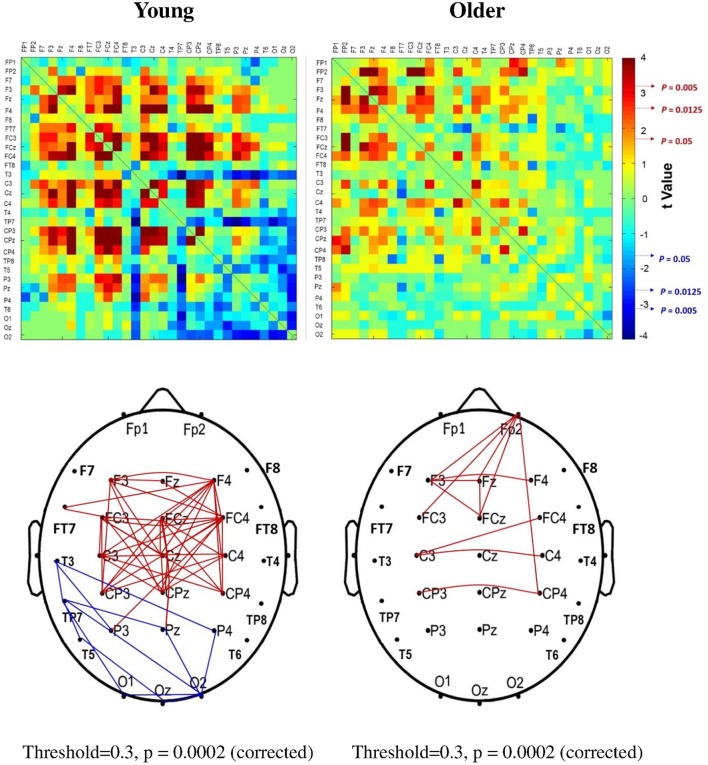
Figure 9.
The adjacent matrix of t-values that contrasts SL between the level-surface and stabilometer conditions for the young and older groups (upper plot). The adjacent matrix of t-values clearly shows a different trend of stance-related modulation of SL across all electrode pairs for the young and older groups, (t > 1.771: stabilometer SL > level-surface SL, p < 0.05; t < −1.771: level-surface SL > stabilometer SL, p < 0.05). The lower plots display the results of connectivity analysis with network-based statistics (threshold value = 0.3). A contrasting wiring diagram shows topological distributions of the suprathreshold connectivity that vary with stance difficulty increase for the young and older groups. Red line: stabilometer connectivity of supra-threshold > level-surface connectivity of supra-threshold, p < 0.005; blue line: level-surface connectivity of supra-threshold > stabilometer connectivity of supra-threshold, p < 0.005.

