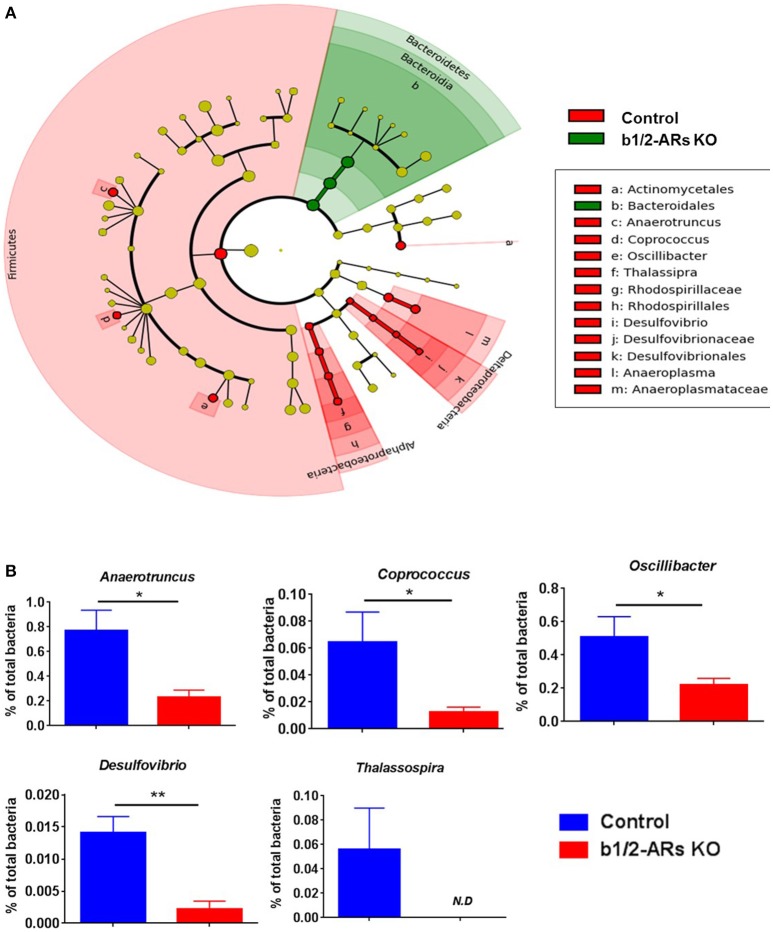
Figure 2.
Contraction of Proteobacteria phylum in the b1/2-ARs KO chimera. (A) Taxonomic cladogram was generated by performing linear discriminant analysis (LDA) of effect size (LEfSe) in Galaxy (Segata et al., 2011). Each circle dot represents a bacterial taxon with its diameter proportional to the taxon's relative abundance. Differences are represented in colors where red indicates significant relative abundance in C57 chimera, green indicates significant relative abundance in b1/2-ARs KO chimera, and yellow indicates no significant differences. (B) Unpaired two-tailed t-test analyses of genera with significant differences between b1/2-ARs KO chimera and C57 control chimera. * indicates P < 0.05 and ** indicates P < 0.01.

