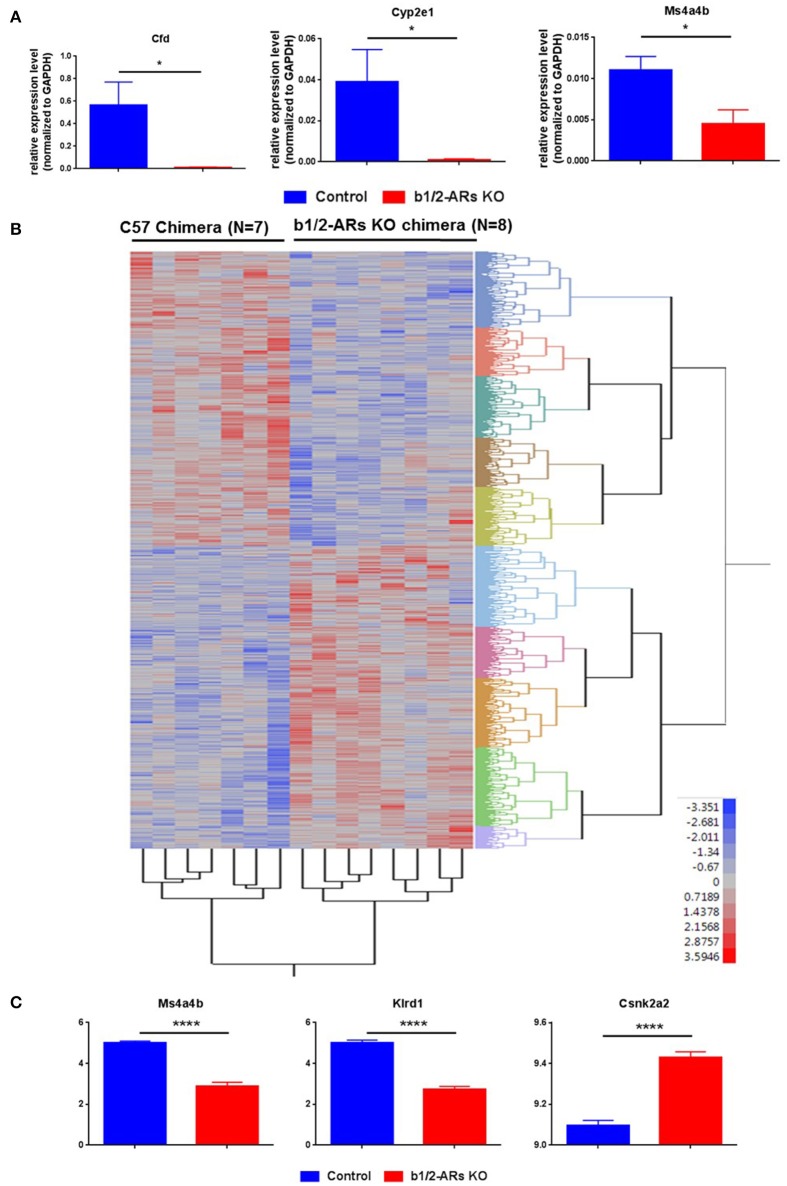
Figure 4.
Heatmap of differentially expressed probes (unadjusted, P < 0.05) between C57 and b1/2-ARs KO chimera. (A) Validation of microarray data by real time PCR. Three genes were selected for validation of microarray analyses. Bar graph shows relative expression level of gene normalized to GAPDH expression. (B) There was a clear distinction between all individuals from each group, with two expression clades evident. (C) The three transcripts with the most significant differences between two groups in the microarray analyses are identified as Klrd1, Ms4a4b and Csnk2a2, presented in the bar graph. Two tailed unpaired t-test analysis indicates ****P < 0.0001. Adjusted P-values are 0.0042, 0.0085, and 0.0216, respectively. *indicated unpaired t-test P < 0.05.

