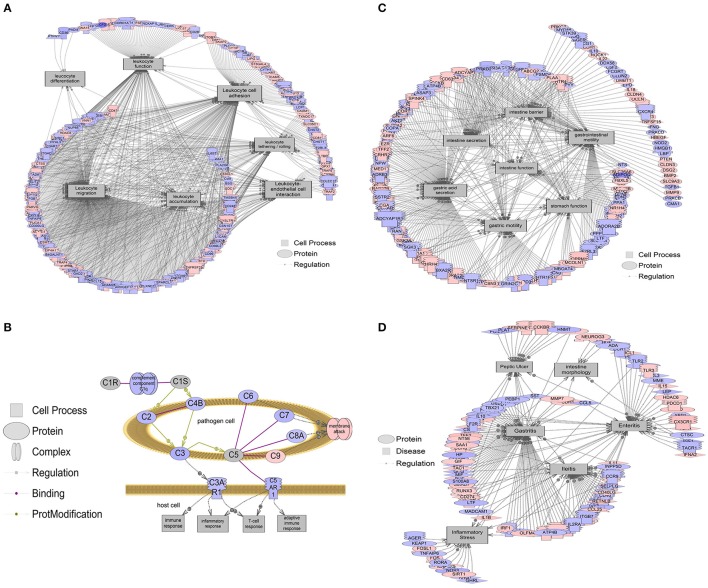
Figure 5.
Gene networks associated with intestinal processes and diseases. Red indicates that relative mRNA levels are increased for the transcript, while blue indicates that relative mRNA levels are decreased for the transcript. The square entities refer to cell processes, the oval entities refer to proteins in general, triangles represent ligands, and receptors are those molecules embedded in the membrane with the mushroom cap. The arrows indicate direction of entity regulation. (A) Gene networks associated with leukocyte functions, including leukocyte adhesion, tethering/rolling, migration, accumulation, differentiation, and interaction with endothelial cells, were all altered. The mean fold change of the entire network is ~10% (1.1-fold). (B) Overall suppression in the classical complement system in the colon of b1/2-ARs KO chimera. The mean fold change of this gene network is ~21% decrease (1.21-fold). (C) Gene networks associated with intestine function, including barrier integrity, secretion, and motility were decreased by 6.5% (1.065-fold). (D) Gene networks associated with intestinal conditions including intestine morphology, enteritis, ileitis, and inflammatory stress are decreased by 7.5% (1.075-fold). Complete data are presented in Appendix 1 and 2. All genes within a pathway are located in Appendix 2.

