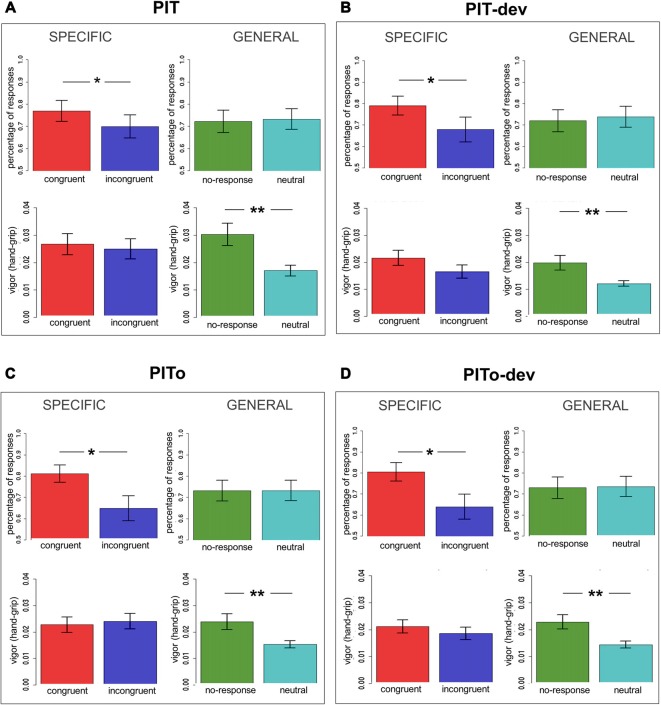
Figure 3.
PIT effect across tasks. Panel (A) shows the first transfer task performed (PIT); panel (B) shows PIT under devaluation (PIT-dev); panel (C) shows PIT after overtraining (PITo); panel (D) shows PIT after overtraining under devaluation (PITo-dev). All panels show results for outcome-specific and general transfer on both percentage of responses and hand-grip. Bars indicate standard error of the mean. PIT, Pavlovian-to-Instrumental Transfer. *p < 0.05; **p < 0.01.

