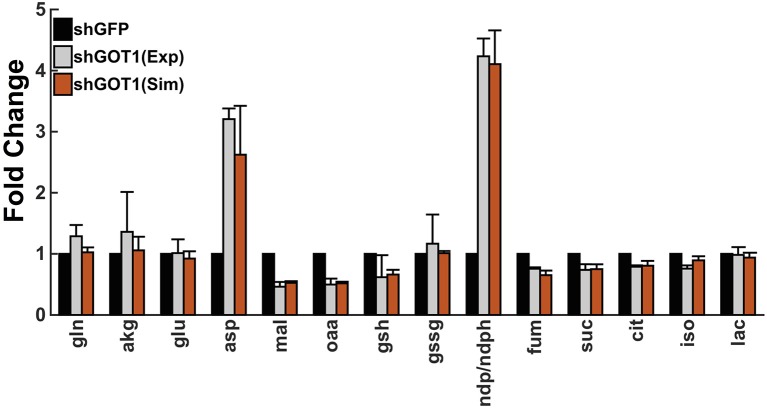
Figure 2.
Model fit to experimental data. The model predictions for the fold-change in the metabolite concentrations (orange bars) match the experimental measurements from Son et al. (2013) (gray bars). Error bars for the predicted fold-change represent the standard deviation in the model predictions for the best fit from each of the 50 initial conditions. The simulated values of the metabolites derived from the mitochondria and cytoplasm are summed together to determine the total cellular metabolite pool, which was measured in the experiments.

