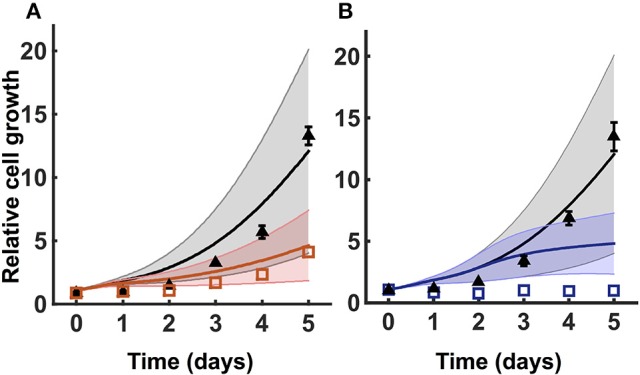
Figure 4.

Model robustness. Model simulation using 1,000 random initial conditions selected from a Gaussian distribution, as described in Section 3.3. (A) Simulations under no knockdown (black) and GOT1 knockdown (red). (B) Simulations with complete media (black) and nutrient deprivation after 24 h (blue). In both (A,B), triangles and squares represent the experimental data with error bars as available. The solid lines indicate the mean of predicted results for 1,000 sets of initial conditions, where the shading shows the standard deviation.
