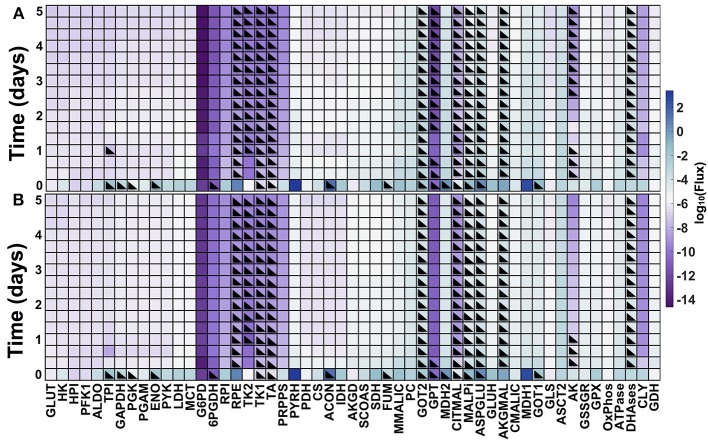
Figure 6.
Predicted metabolic fluxes. Dynamic fluxes predicted by the model for: (A) no knockdown and (B) GOT1 knockdown. The color bar indicates the magnitude of the flux on a log scale. Black triangles denote the time points at which the flux is in the opposite direction (i.e., negative flux), compared to the baseline model shown in Figure 1.

