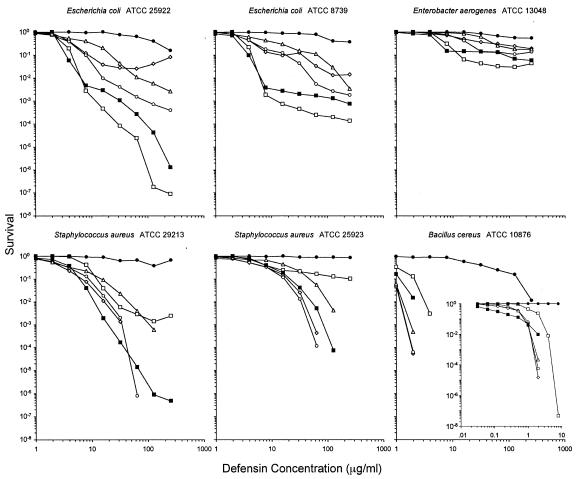
FIG. 3.
Survival curves. Each curve is the mean of triplicate experiments. Open markers are human neutrophil defensins (⋄, HNP1; ○, HNP2; ▵, HNP3; □, HNP4). Filled symbols are human intestinal defensins (▪, HD5; •, HD6). Points scored as zero survival could not be plotted. All strains were exposed to defensins at concentrations that varied twofold from 1 to 256 μg/ml. In addition, B. cereus was assayed against a twofold dilution series of 0.031 to 8 μg/ml (inset).

