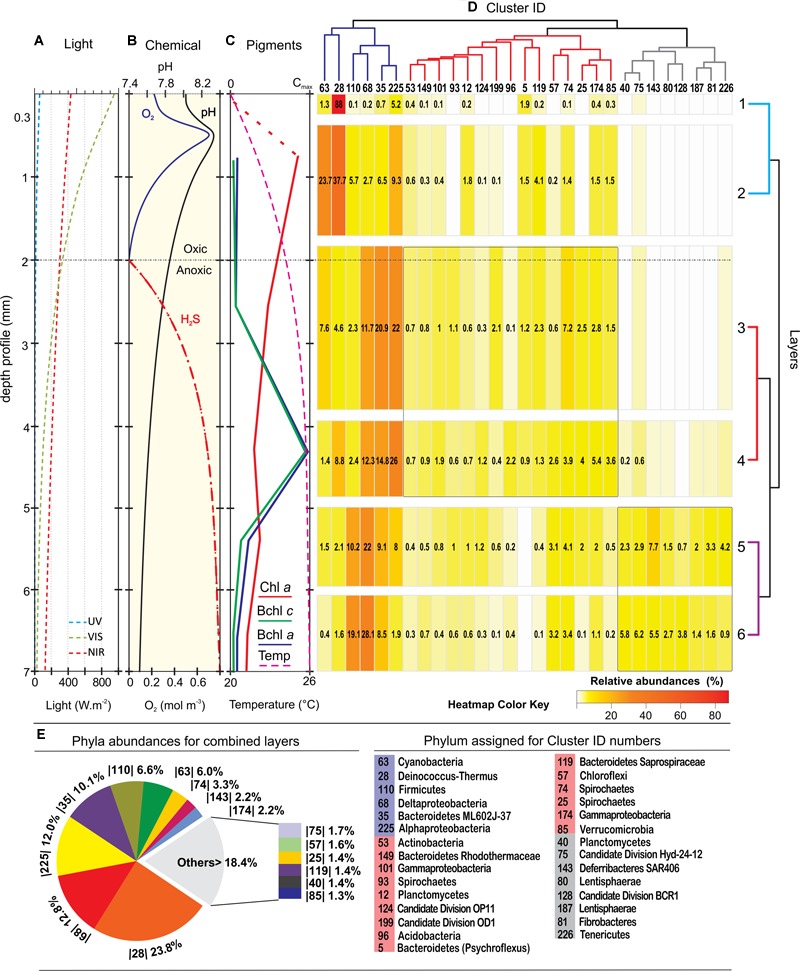
FIGURE 3.

Depth profiles of physico-chemical parameters and bacterial diversity. (A) Light profile; (B) oxygen, pH, and H2S profile; (C) pigment profile adapted from Farías et al., 2013). (D) Heatmap of the 29 most abundant clusters of sequences; (E) phyla abundances for the combined layers. The clusters, represented in a dendrogram according to their pattern of distribution, displays three main branches; the dark-blue branch with key functional groups that were present virtually in all layers, although they clearly concentrate in great abundance at three different levels; the red branch showing clusters that were mostly widespread in the middle; and the gray branch with clusters located at dark anoxic layers. The phylum assignation of the clusters ID are listed down, and the ‘best hit’ taxonomic assignations are listed in the Supplementary Figure S2. Relative abundances (>0.1%) in the heatmap are indicated within the boxes in numbers and with a color key. A dendrogram of the layers shows pairs that match according to their different biological and physicochemical microenvironment.
