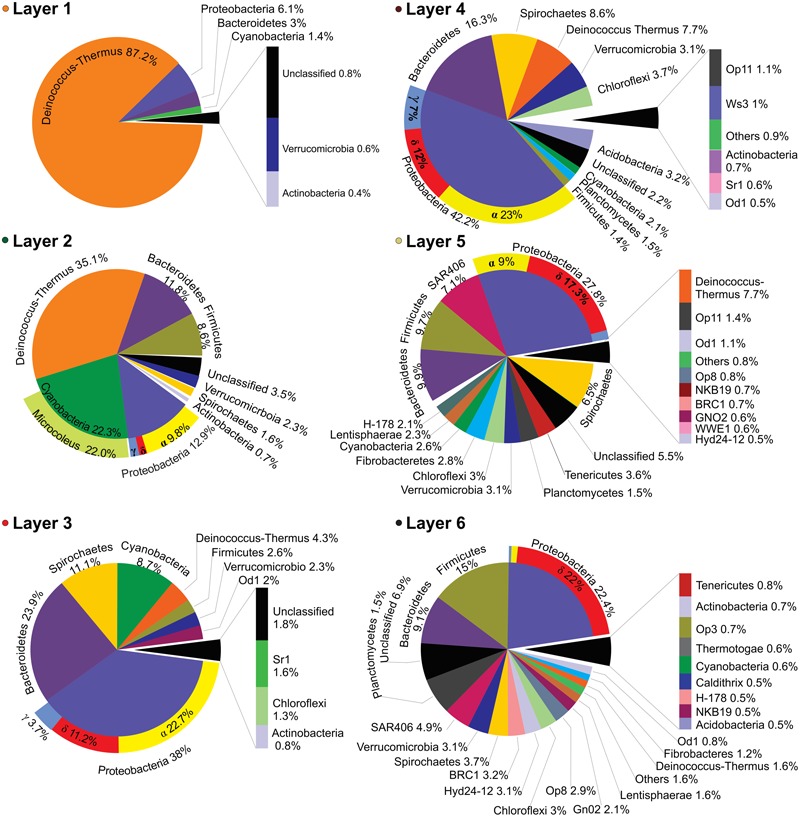
FIGURE 4.

Layer-by-layer taxonomical profile. Bacterial taxonomic assignations of all six layers expressed in percentage of the relative abundances obtained from the 16S (HV4) pyrotags clustered at 97% OTU identity level and classified against the green-genes database. Only OTUs with values ≥ 0.4% were plotted.
