Figure 5.
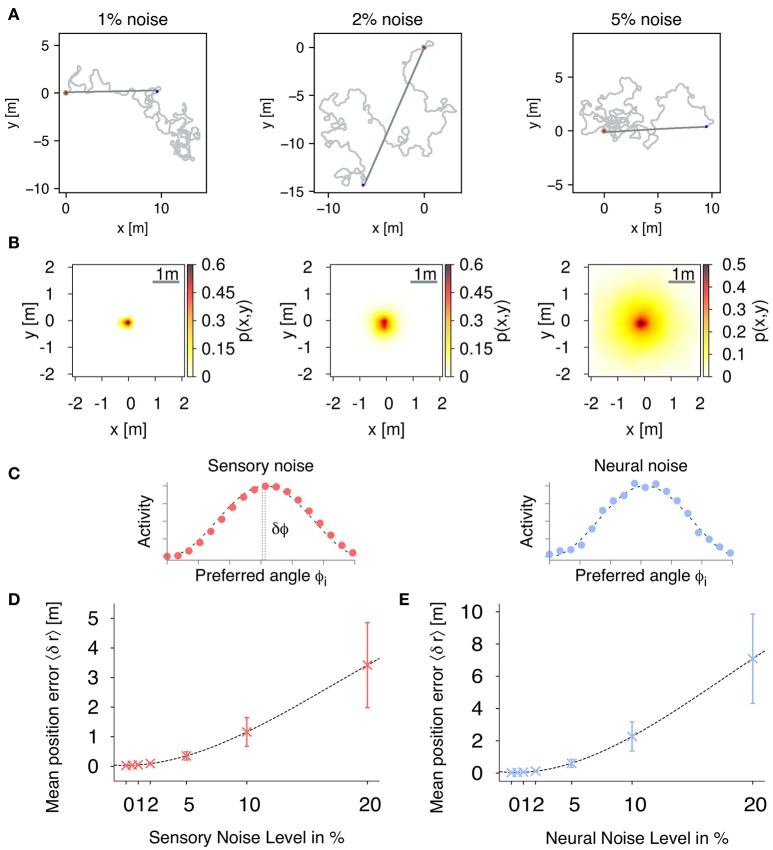
Path integration (PI) accuracy under the influence of external noise. (A) Example trajectories of the simulated agent during random foraging (light gray) and homing behavior (dark gray) for different sensory, correlated noise levels: 1, 2, and 5%. The red point marks the starting point at the nest, and the blue point indicates the return, when the agent switches to its inward state. Using only path integration, the agent successfully navigates back to the nest with a home radius (green circle) of 0.2 m. (B) We evaluate the accuracy of the proposed PI mechanism by using the mean positional error averaged over each time step during each trial. Distribution of positional errors for different sensory, correlated noise levels: 1, 2, and 5%. (C) Examples of population-coded HD activities with correlated and uncorrelated noise. Filled dots are activities of individual neurons, while the dashed line is a cosine response function. (D) Mean position errors 〈δr〉 (± S.D.) in PI with respect to fully correlated, sensory noise levels averaged over 1,000 trials (fixed number of 18 neurons per layer). (E) Mean position errors 〈δr〉 (± S.D.) in PI with respect to uncorrelated, neural noise levels averaged over 1,000 trials (fixed number of 18 neurons per layer).

