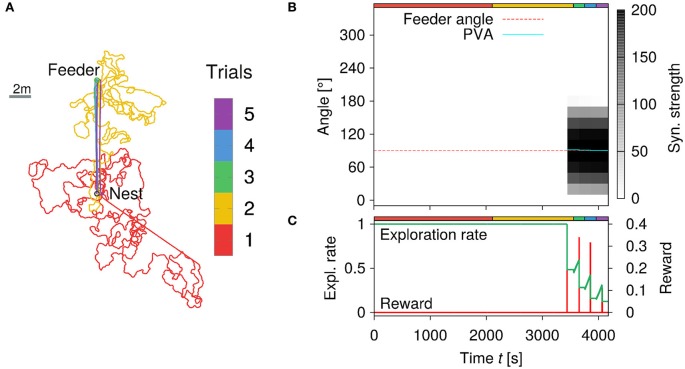
Figure 8.
Learning walks of the simulated agent for a feeder placed Lfeed = 10 m away from the nest. (A) Trajectories of the agent for five trials with a feeder in 10 m distance and 90° angle to the nest. Each trial number is color-coded (see colorbar). Inward runs are characterized by straight paths controlled only by PI. See text for details. (B) Synaptic strengths of the GV array changes due to learning over time (of the five trials). The estimated angle θGV (cyan-colored solid line) to the feeder is given by the position of the maximum synaptic strength. (C) Exploration rate and food reward signal with respect to time. The exploration rate decreases as the agent repeatedly visits the feeder and receives reward.

