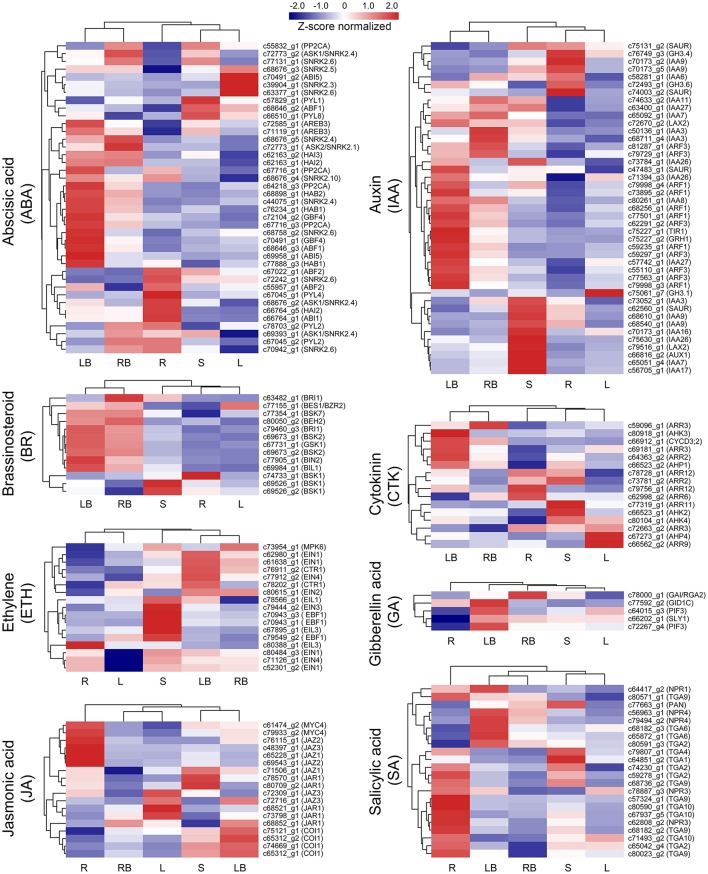
Figure 8.
Expression profile of hormone signaling-related genes across five different tissues. The expression of genes involved in hormone signaling and transduction-related pathways was Z-score normalized and hierarchically clustered in heatmap. A color scale is shown at the top. Blue color indicates lower expression, while red color indicates higher expression. L, leaf; S, stem; R, root; LB, lateral bud; RB, rhizome bud.

