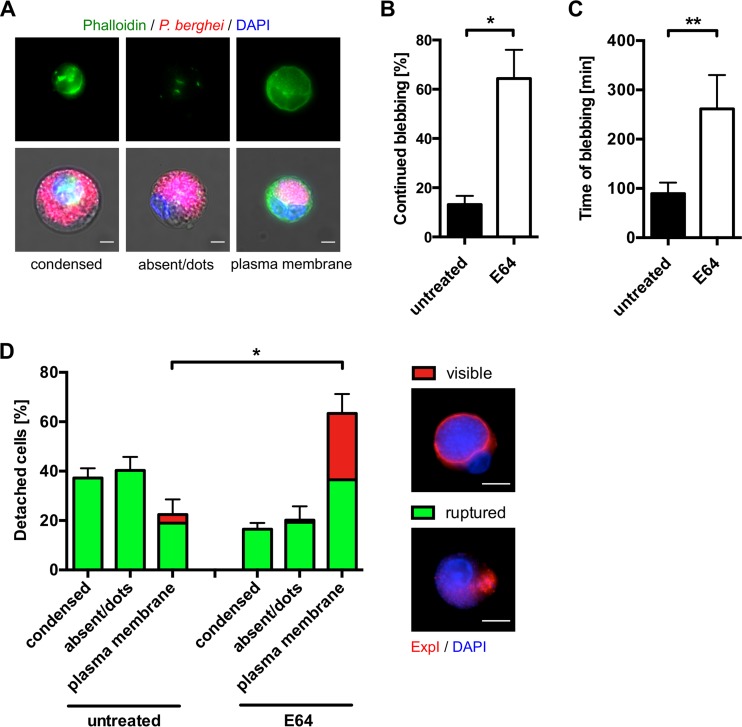
FIG 2 .
Treatment with the general cysteine protease inhibitor E64 interferes with modulation of the host cell actin cytoskeleton. (A) Different types of actin localization (condensed, absent or dots, and plasma membrane associated) in phalloidin-stained detached cells. HeLa cells were infected with mCherry-expressing parasites (red), and at 65 hpi, detached cells were harvested, fixed, and stained with phalloidin (green). Nuclei were visualized with DAPI (blue). (B, C) E64 treatment prevents termination of Plasmodium-induced blebbing. HeLa cells were infected with mCherry-expressing parasites and at 55 hpi treated with 10 µg/ml E64 or left untreated. Plasmodium-induced blebbing was analyzed by live-cell time-lapse imaging starting at 56 hpi for a period of 12 h. Thereby, only those parasites were analyzed that started blebbing within the first 6 h of imaging. The percentage of infected cells that continued blebbing and did not terminate the blebbing process within the imaging time is shown in panel B. The average blebbing time of infected cells that terminated the blebbing process is displayed in panel C. Shown are the mean and the standard error of the mean of three independent imaging experiments in which a total of 37 egress events of untreated and 25 egress events of E64-treated parasites were observed. Eleven untreated and four E64-treated infected cells did not show blebbing and were not included in the analysis. For statistical analysis, an unpaired two-tailed t test was performed. Statistically significant differences are indicated by asterisks (*, P < 0.05; **, P < 0.01). See also Movie S3. (D) Quantification of actin localization after E64-mediated inhibition of complete PVM rupture. HeLa cells were infected with parasites expressing the PVM marker protein ExpI fused to mCherry. At 56 hpi, 10 µg/ml E64 was added or cells were left untreated. At 65 hpi, detached cells were harvested, fixed, and stained with phalloidin. The percentages of the different types of actin localization were quantified in three independent experiments in which 221 untreated and 232 E64-treated detached cells were analyzed in total. Shown are the mean and the standard error of the mean. Cells with a ruptured PVM are indicated in green, while cells with a visible PVM are indicated in red. Representative detached cells with a visible and ruptured PVM are shown on the right, where the PVM marker ExpI is displayed in red and DAPI-stained nuclei are shown in blue. For statistical analysis, an unpaired two-tailed t test was performed. Statistically significant differences are indicated by asterisks (*, P < 0.05). All scale bars, 10 μm.

