
FIG 3 .
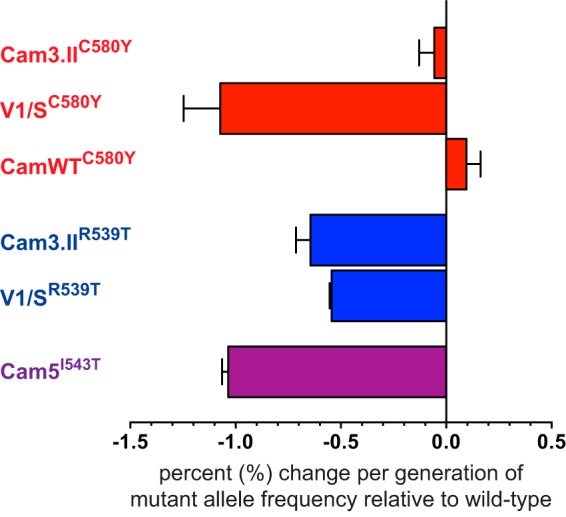
K13 mutations confer an in vitro fitness cost in clinical isolates and reference lines. Results show differences in growth rates per 48-h generation of clinical isolates and reference lines harboring native or ZFN-edited K13 mutations (shown in superscript) relative to their isogenic parasite lines carrying the wild-type K13 allele (e.g., Cam3.IIC580Y versus Cam3.IIrev, showing a mean 0.06% reduction in the rate of growth of the C580Y mutant relative to its isogenic K13 wild-type control). Differences in growth rates were calculated as the percent change in K13 mutant allele frequency over a 60-day coculture period, as determined by pyrosequencing. Values are shown as means ± SEM (error bars) in two independent assays performed in duplicate.