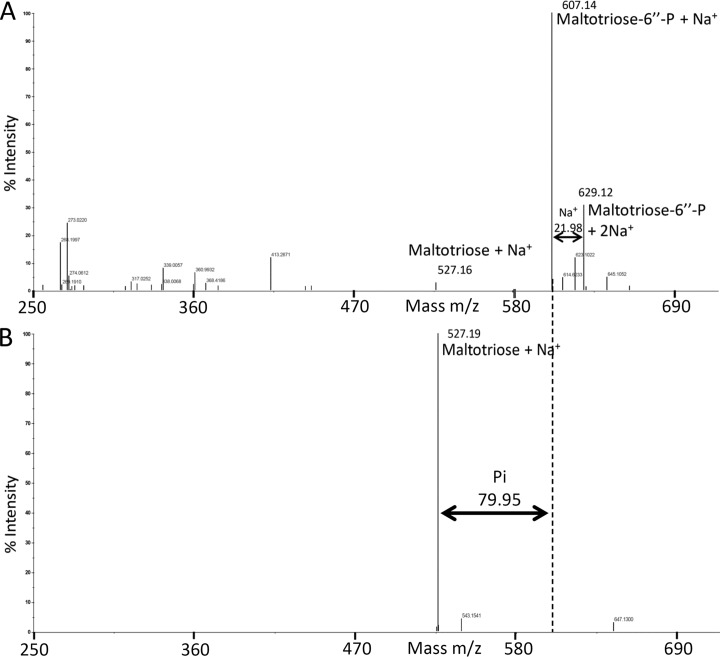
FIG 6.
MapP-catalyzed dephosphorylation of maltotriose-6″-P, as evidenced by mass spectrometry. Dephosphorylation assays of maltotriose-6″-P with E. faecalis MapP and subsequent analysis by mass spectrometry were carried out as described in Materials and Methods. (A) Untreated maltotriose-6″-P: the weak peak with a mass m/z 527.16 corresponds to unphosphorylated maltotriose containing one Na+ ion. The two strongest peaks at m/z 604.14 and 629.12 correspond to maltotriose-6″-P with one [(M+H)+Na+] and two [(M+H)+2Na+] Na+ ions, respectively. (B) MapP-treated maltotriose-6″-P: the two strong peaks in panel A completely disappeared after treatment with MapP, and a very strong single peak appeared at m/z 527.19, which corresponds to maltotriose carrying one Na+ adduct.

