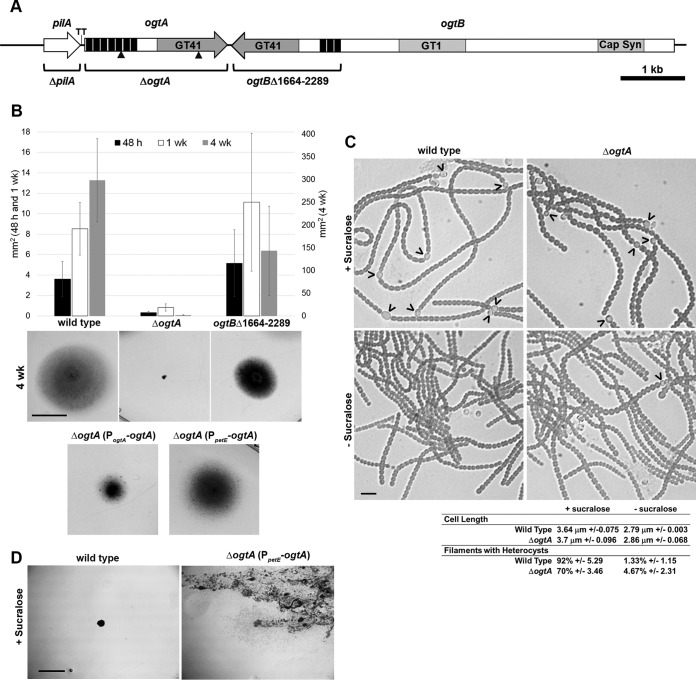
FIG 2.
Phenotypic characterization of the ΔogtA and ogtBΔ1664–2289 mutant strains. (A) Schematic diagram of the genomic region harboring pilA, ogtA, and ogtB. Triangles indicate the location of transposon insertions. Deleted regions are indicated for each deletion strain. GT41, glycosyl transferase 41; GT1, glycosyl transferase 1; Cap Syn, capsular polysaccharide export domain; black bars, TPR repeats; TT, transcription terminator. (B) Quantification (average of 3 biological replicates; error bars = 1 standard deviation [SD]) and representative photographs (4-week images; bar = 1 cm) of results from plate motility assays. (C) Light micrographs of and quantitative data for hormogonium characteristics for the wild-type and ΔogtA mutant strains before and after induction of hormogonia by the removal of sucralose. Heterocysts attached to filaments are indicated by carets; ± values indicate 1 SD. Bar = 10 μm. (D) Photographs depicting serial transfer of colonies of the wild-type strain or attempts to streak for isolation of the ΔogtA mutant strain expressing ogtA from the petE promoter (PpetE-ogtA) on medium containing sucralose. Bar = 5 mm. The presence of diffuse cell material is indicative of the spreading of colonies due to the differentiation of motile hormogonia.

