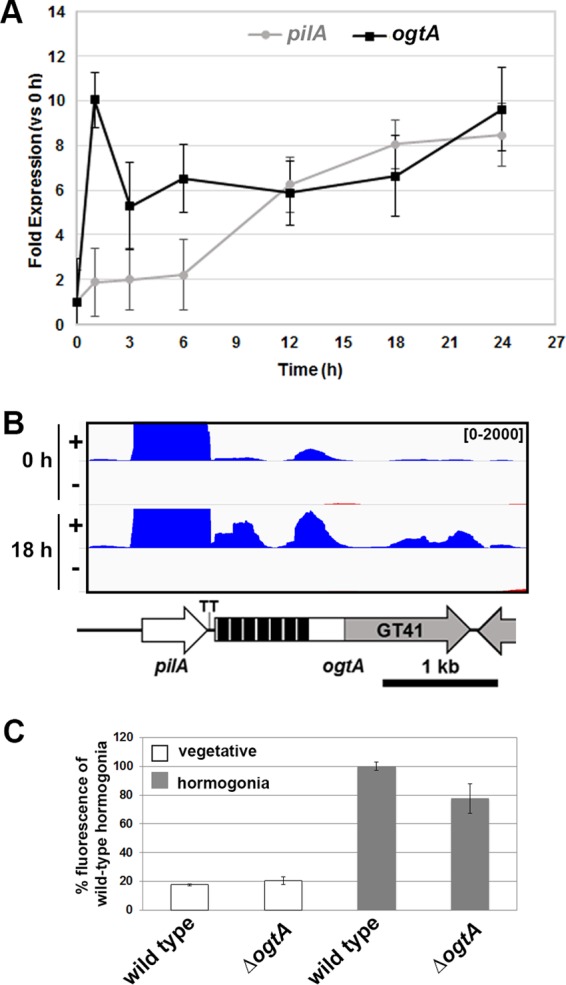
FIG 3.

Transcription of ogtA and pilA. (A) qPCR analysis of ogtA and pilA expression over the time course of hormogonium development in the wild-type strain (n = 3; error bars = 1 SD). (B) Transcript map displaying the read coverage from RNA-seq data for both the positive and negative strands (as indicated) for the genomic region containing pilA and ogtA at 0 and 18 h post-hormogonium induction. Value range, 0 to 2,000 reads per bp. Details on the gene map are given in the legend to Fig. 2. (C) Quantification of sfgfp-aav expression from an ogtA promoter region-gfp reporter construct (PogtA-sfgfp-aav in pBK111) in vegetative filaments or hormogonia (24 h postinduction) of the wild-type or ΔogtA mutant strain. Values are expressed as a percentage of the fluorescence intensity for wild-type hormogonia 24 h postinduction (n = 3; error bars = 1 SD).
