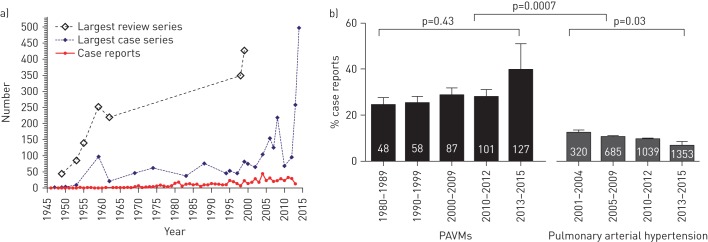
FIGURE 1.
Evolution of pulmonary arteriovenous malformations (PAVMs) evidence base since 1945. a) Types of articles. For case series and review articles, “number” represents the number of cases within an individual paper. For case reports, “number” represents the number of case reports published per calendar year. b) Proportion of published literature per annum that is represented by single case reports, comparing PAVMs with pulmonary arterial hypertension. Mean and standard error indicated for each time period. White figures indicate mean number of publications per annum within the stated decade/time period. Within group p-values were calculated by Kruskal–Wallis, between group by Mann–Whitney.

