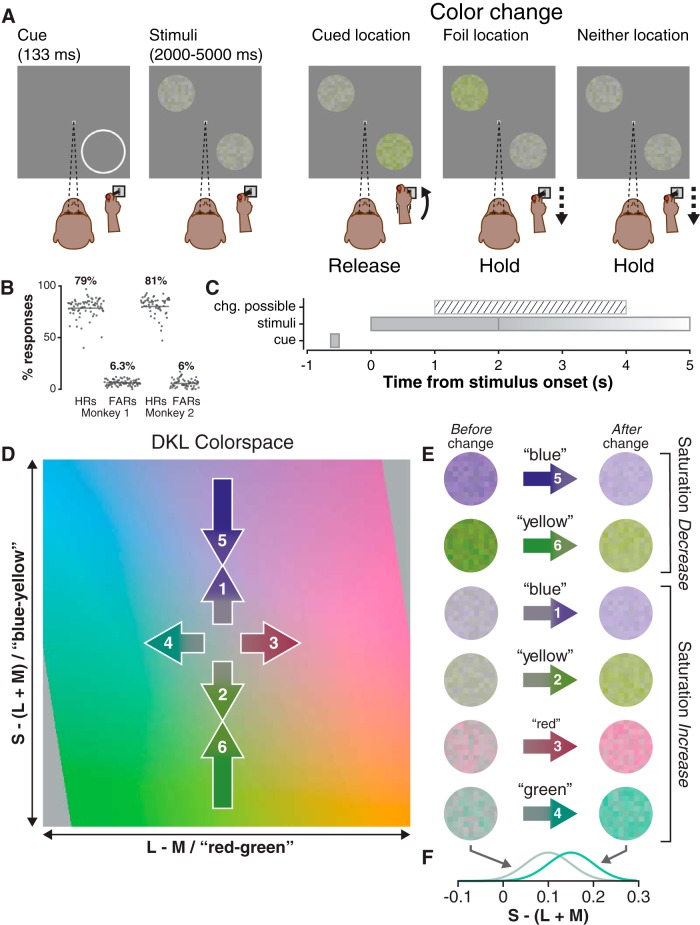
Figure 1.
Attention task procedure, stimuli, and behavior. A, Procedure: the monkey was required to hold down the joystick and maintain central fixation throughout the trial, releasing his hold only for cued stimulus changes. The cued stimulus patch was presented in the location previously occupied by the flashed cue-ring (the bottom right of the screen, in this example), and the foil was presented at an equally eccentric opposing location (top left). Only one stimulus changed per trial (see Materials and Methods). B, Hit rates (HRs) and false-alarm rates (FARs) for monkey 1 and 2 in each session; percentages are across-session binomial parameter estimates and horizontal lines are 95% confidence intervals. C, Trial timeline illustrates the time window in which a color change was possible relative to stimulus presentation; stimuli were presented for 1 s beyond the time of the color change. D, Stimulus colors were drawn from an isoluminant plane of the DKL color space. Axes were scaled to the [−1, +1] interval with limits representing the maximum possible contrast for the display (see Materials and Methods). Numbered arrows (not to scale) represent color changes in saturation increase (1, 2, 3, 4) and saturation decrease (5, 6) trials; saturation decreases were approximately two to four times larger than saturation increases and were arranged so that the mean saturation was the same following either an increase or a decrease. E, Example stimulus frames before (left) and after (right) saturation increases (1, 2, 3, 4) and decreases (5, 6). Note that after a blue increase (1) or a blue decrease (5), the saturation was the same, as mentioned above; the same was true for yellow increase (2) and decrease (6). F, Example saturation distributions for stimuli before and after a green saturation increase; before increase, Gaussian distribution has (mean, SD) of (0.1, 0.05) and (0.15, 0.05) after increase.

