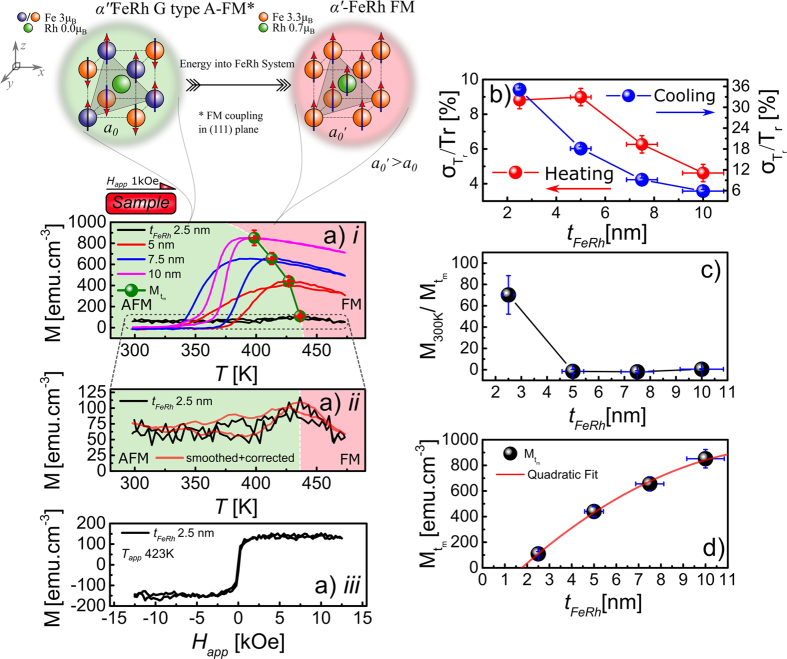
Figure 1.
Magnetometry obtained by VSM showing the effect of film thickness of tFeRh; (a) i thermal hysteresis loops performed with an inplane field of 1kOe showing the AFM(green) to FM(red) regions. Also plotted is the maximum point of the phase transition  as a function of the temperature at which that this occurs Tm; (a) ii shows the thermal hysteresis for the 2.5 nm film along with the 10pt Savitzky–Golay filtered and drift corrected data; (a) iii shows the M-H data for the 2.5 nm film taken at an average a temperature of 423 K. The outset (above) shows schematically the magnetic order of the Fe sub-lattices before and after the phase transition in addition to the induced moment on the Rh atom; (b) the extracted normalised transition temperature distribution as a function of film thickness during the heating and cooling cycles; (c) ratio of the magnetization before, M300K, and after at the maximum point of the phase transition
  and (d)
  as a function of film thickness fitted with a quadratic function.

