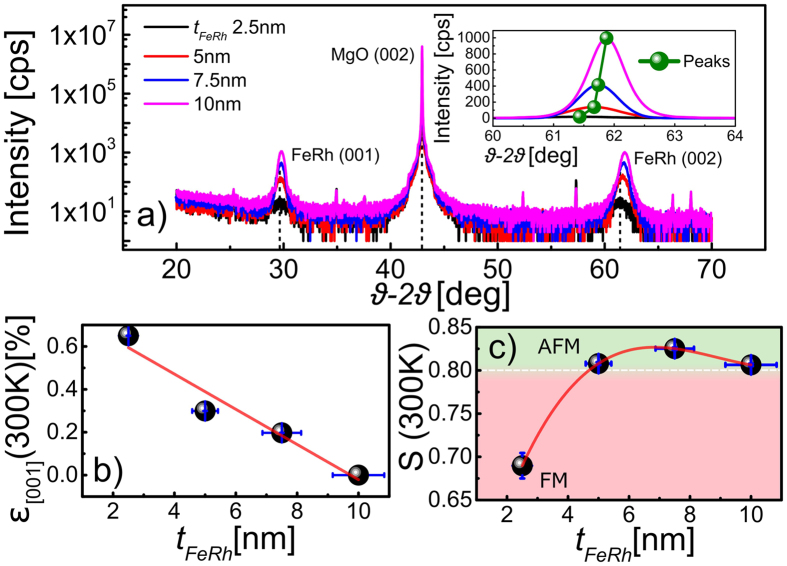
Figure 2.
Structural analysis obtained by XRD in Bragg-Brentano geometry showing; (a) θ–2θ spectra for the thickness ranges 10 nm–2.5 nm, inset peak fits shows the shift in the FeRh (002) diffraction peak as the thickness of the film is reduced (highlighted are the (001) and (002) FeRh peaks); (b) shows the calculated perpendicular strain at 300K as a function of the film thickness relative to the 10 nm FeRh film (red line is a guide to the eye) and (c) shows the extracted ordering parameter S calculated from the integrated intensity of the fundamental (001) and superlattice (002) peaks, the shaded regions represent the films that exhibit AFM (green) or FM (red) behavior at 300K (red line is a guide to the eye).

