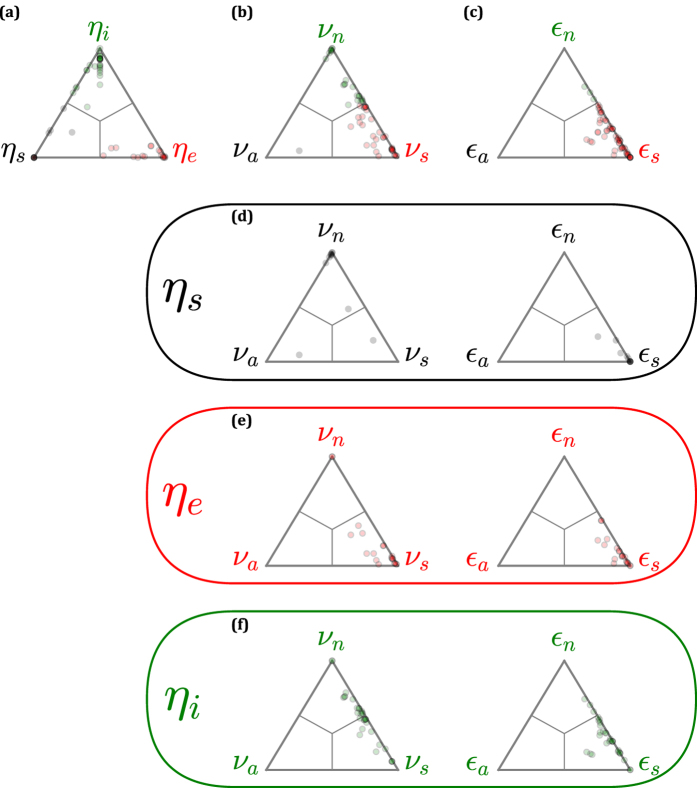
Figure 2. Distributions of empirical networks according to three sets of control measures.
Each set includes three measures that sum to 1 for a given network. The distributions are shown on ternary plots, where a network at the center corresponds to a set of values (1/3, 1/3, 1/3) and a network at a corner corresponds to e.g. (1, 0, 0). Networks are represented with colored according to their maximal parameter. Interior lines indicate the regions where each parameter is largest. (a) The control profile of Ruths & Ruths23. Directly-controlled nodes are either source nodes (ηs), arise due to internal dilations (ηi), or arise due to external dilations (ηe). (b) The fraction of nodes that are always (νa), sometimes (νs), or never (νn) directly controlled, when considering all control schemes that minimize the number of controls. (c) The fraction of edges that are always (εa), sometimes (εs), or never (εn) on a control signal path, when considering all control schemes that minimize the number of controls. (d–f) The degeneracy measures applied independently to the cases where ηs, ηe, and ηi are the dominant parameter in the control profile. Each plot is uniformly colored according to the corresponding dominant control profile parameter (as labeled on the left of the panel). The formatting of each plot otherwise follows (a–c).

