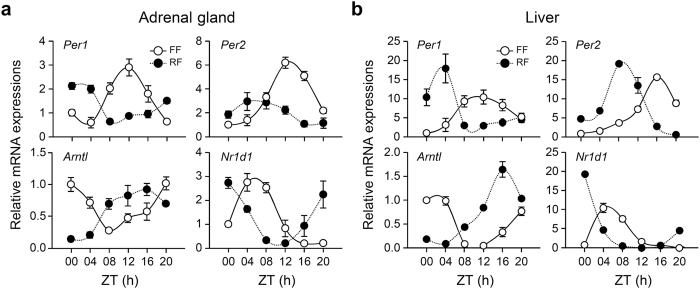
Figure 2. Effect of restricted feeding on clock gene expression in the adrenal gland and liver.
Daily profiles of Per1, Per2, Arntl, and Nr1d1 mRNA expression in the adrenal gland (a) and liver (b) of freely fed (FF) and restricted fed (RF) mice were determined by quantitative RT-PCR. Data were normalized to levels of TBP and expressed as mean ± SE (n = 4).

