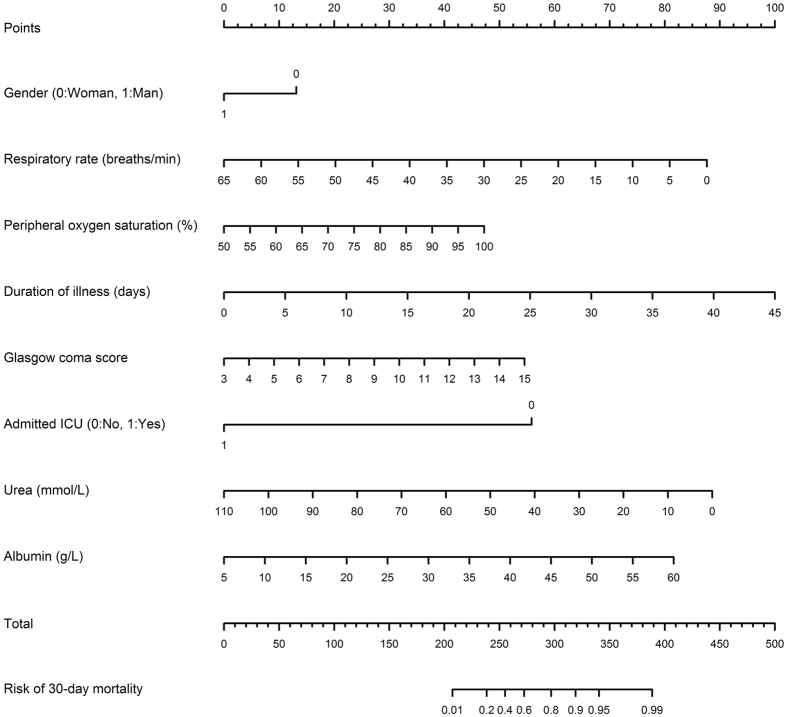
Figure 3. Nomogram for predicting the 30-day mortality risk based on Model II.
Instruction for usage: Mark the gender of an individual on the “Gender” axis and draw a vertical line to the “Points” axis to determine how many points toward the probability of mortality the individual receives for his/her gender value. Repeat the process for each additional predictor. Sum the points of the predictors. Locate the final sum on the “Total” axis. Draw a vertical line down to the 30-day risk line to find the individual’s probability of sustaining mortality within 30 days (ICU: Intensive care unit).

