
Fig. 3.
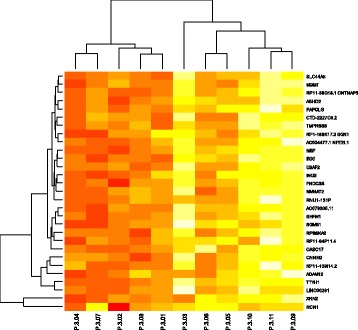
Hierarchical clustering analyses of patients with Gleason score > 7. The scaled enrichment score of individual patients is plotted in a red-yellow scale. Color intensity reflects magnitude of enrichment score, with red indicating high H3K27me3 enrichment and yellow indicating low H3K27me3 enrichment. Columns represent individual tissues. Rows represent the genes. The dendogram represents overall similarities in patient profiles