
Fig. 3.
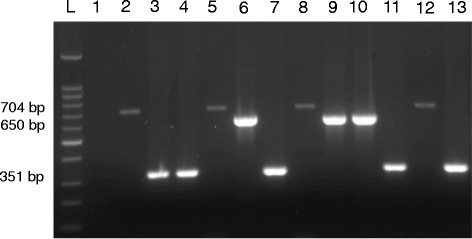
Representative 1% agarose gel showing Blastocystis subtyping based on PCR-STS analysis. (Lane L) shows 100 bp DNA ladder; (Lane 1) represents negative control. (Lanes 2,5,8 and 12) show 704 bp PCR products and represent Blastocystis subtype-V. (Lanes 3,4,7,11 and 13) show 351 bp PCR products and represent Blastocystis subtype-I. (Lanes 6,9 and 10) show 650 bp PCR products and represent Blastocystis subtype-II