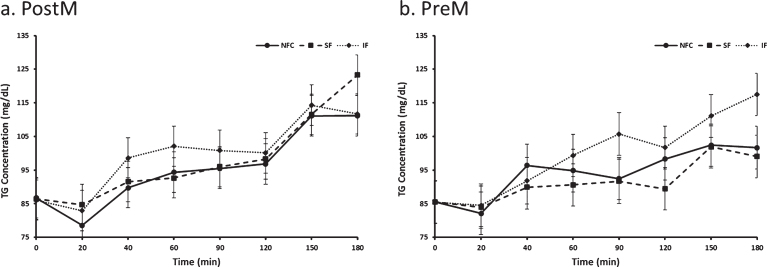
Fig. 7a and b.
Variation of triglyceride responses to NFC-No Fiber Control, IF-Insoluble Fiber, SF-Soluble Fiber meals in Postmenopausal (PostM, n = 10) and Premenopausal (PreM, n = 9) women (Figs. 8a and b, respectively). Values are the means±SEM at each time point. Different letters at the same time point denotes significant difference, p < 0.05.

