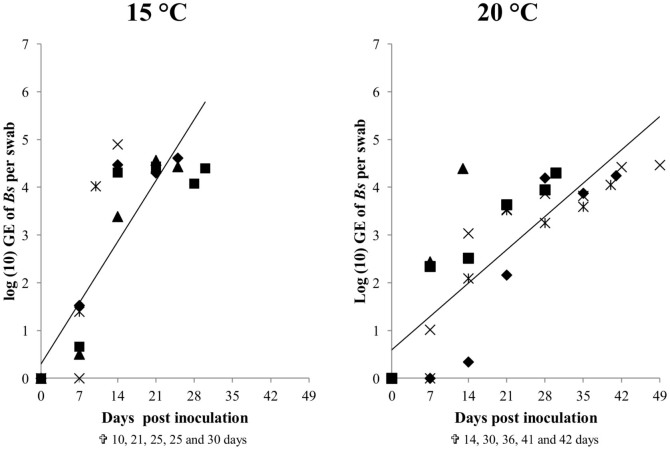
Figure 1. The course of Batrachochytrium salamandrivorans infection in fire salamanders at 15 and 20°C.
Each symbol represents the course of infection of an individual animal.Time of death of all animals is depicted beneath the graphs. The line represents the average increase in infection intensity in all tested individuals based on a repeated measure regression analysis.

