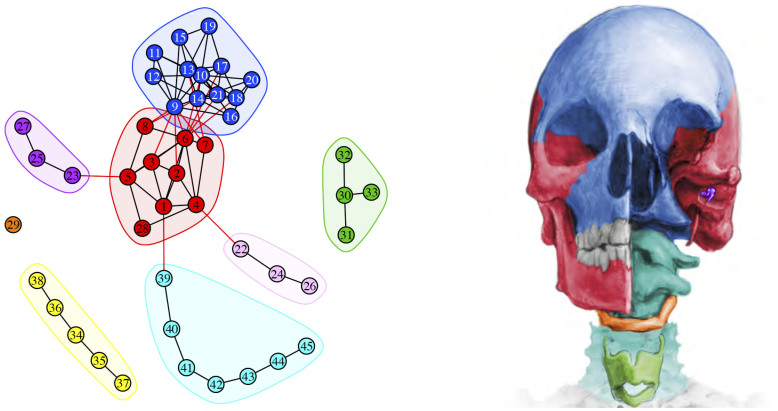
Figure 2. Modules of the head skeleton identified using AnNA.
In red, the cranial complex; in blue, the facial complex; in green, the thyroid complex; in yellow, the thoracic complex; in cyan, the cervical complex; in light and dark purple, the ossicles complexes; and in orange, the hyoid one-bone module. Strength of modularity (Q-value) 0.4977. See labels in Methods. This figure was drawn by Christopher Smith.

