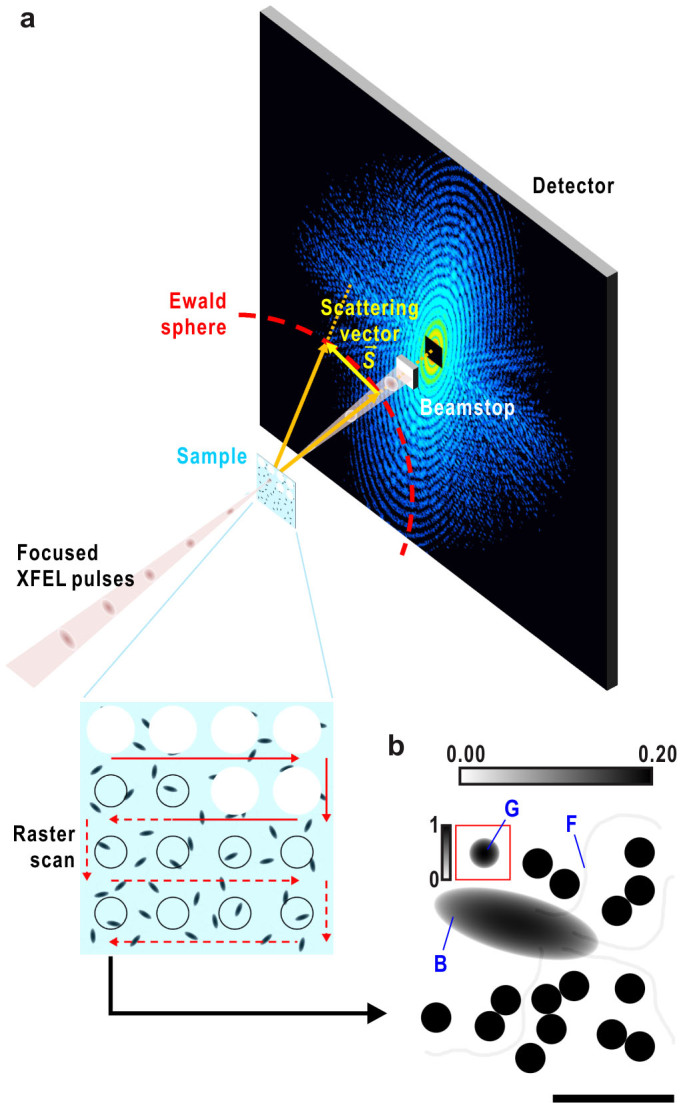
Figure 1. Setup for XFEL-CXDI of biological samples and the model used in this study.

(a) Schematic illustration of cryo-CXDI based on our recent experiments at SACLA11. Frozen-hydrated sample particles are densely dispersed on thin support film11,32. The sample stage is raster scanned to deliver fresh samples for exposure of every focused X-ray pulse. The samples explode just after irradiation of XFEL. Diffraction patterns on the Ewald sphere are recorded on a detector located downstream of the sample, but the central part of the patterns is blocked by a beamstop. (b) Projected electron densities of a model sample. The model is composed of a bacterial cell (B), four flagella (F) and 16 CG particles of 250 nm (G). Gradient scale bar at the top refers to the display contrast relative to the maximum value of the cell and CG particles. One CG particle inside a red square is shown at a lower contrast with the gradient scale bar on the left. Bar indicates ~1 μm.
