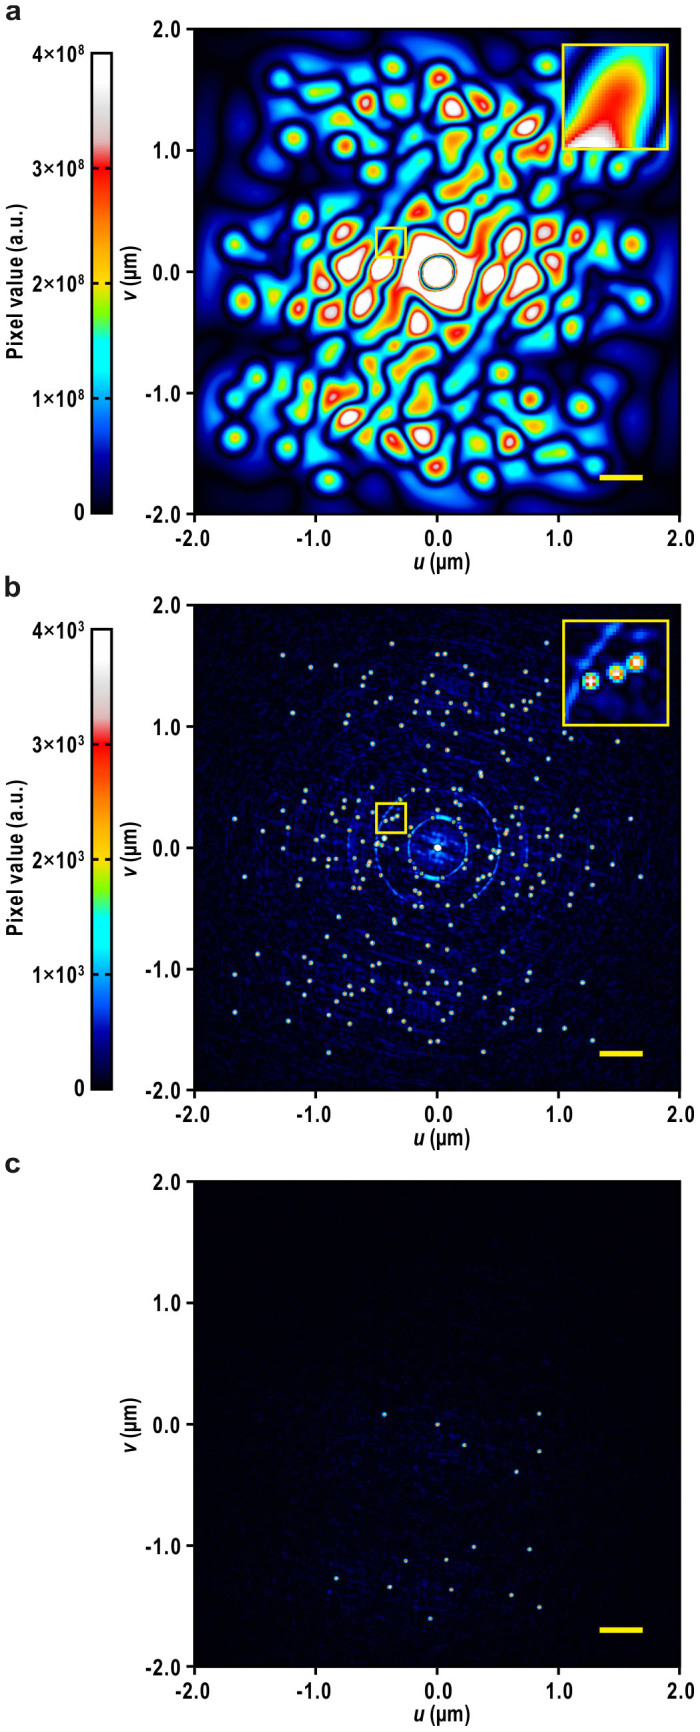
Figure 4. Determination of the positions of the CG particles by Patterson analysis.

(a) Original Patterson map calculated from the signal-enhanced diffraction pattern shown in Fig. 2b. (b) Sharpened Patterson map calculated from the square of the normalized structure amplitude obtained from the same pattern. Insets show zoom-up views of areas enclosed by yellow boxes. (c) A superposition minimum function (SMF; Eq. 5 in Methods) map showing the positions of the CG particles, obtained from the Patterson map in (b) by the Patterson superposition algorithm. Gradient bars for display scale are shown on the left for the maps in (a) and (b), respectively. Display scale of the map in (c) also refers to the gradient bar in (b). Bars represent ~360 nm (50 pixels).
