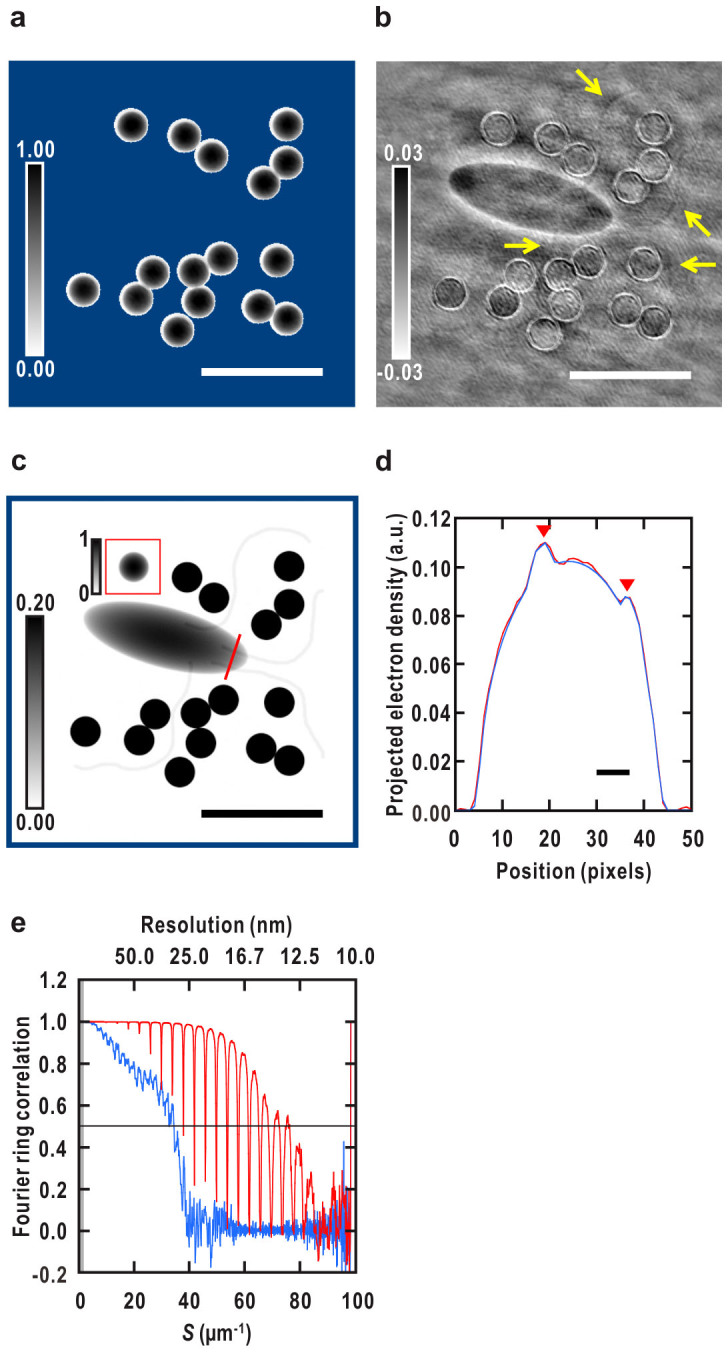
Figure 5. Initial phasing and reconstruction of the density map of all the sample objects.

(a) A typical reconstructed map of the CG particles shown in Fig. 1b. Outside the fixed support area is in blue. (b) A difference Fourier map between the observed amplitude (the square root of Fig. 2b) of the cell-CG model and that of a density map of the CG particles with the phase from the map of the CG particles in (a). Calculated as Eq. 9 (Methods). Arrows indicate densities of the flagella (c.f. Fig. 1b). (c) Reconstructed density map of all the objects shown in Fig. 1b. Average of 100 independent reconstructions. A blue square surrounding the entire map corresponds to the inside of the initial support. Bars represent ~1 μm (140 pixels) in (a)–(c). (d) Density profiles of the reconstruction in red and the test model in blue along a red line in (c). Densities of two filaments inside the cell are indicated by down-pointing triangles. Bar represents ~50 nm (7 pixels). (e) FRC analysis of the density map of all the objects. A FRC curve between the test model (Fig. 1b) and the averaged map of all the objects in (c) is shown in red and a FRC curve between the cell model and an averaged map of the bacterium alone reconstructed from the diffraction pattern without CG (Supplementary Fig. 1a) is shown in blue. The horizontal black line indicates a resolution criterion for the reconstruction (FRC = 0.5). The missing region at center is in gray in (e).
