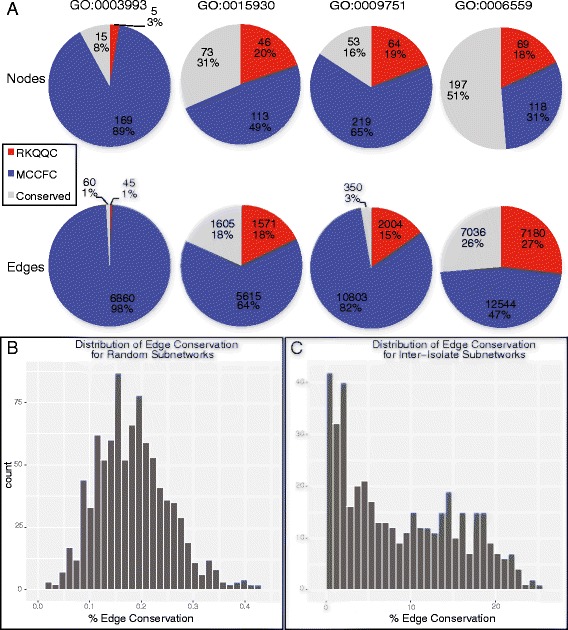
Fig. 5.

Wheat GO sub-networks vary in the degree of network conservation between the Pgt isolate treatments. a Examples of four different GO sub-networks, each including five wheat GO annotated genes, show a high degree of variability in both edge and node conservation between the two Pgt isolate treatments. b Each GO sub-network was randomly regenerated using the same number of nodes and edges observed in our experimentally reconstructed GCNs. For this purpose, sub-networks including five wheat nodes were randomly sampled 1,000 times, and produced a normal distribution of edge conservation values with a mean of 0.18%. c Five node sub-networks were randomly sampled from the real world data, and produced a multi-modal distribution of edge conservation values ranging from 0.05 to 24.81%
