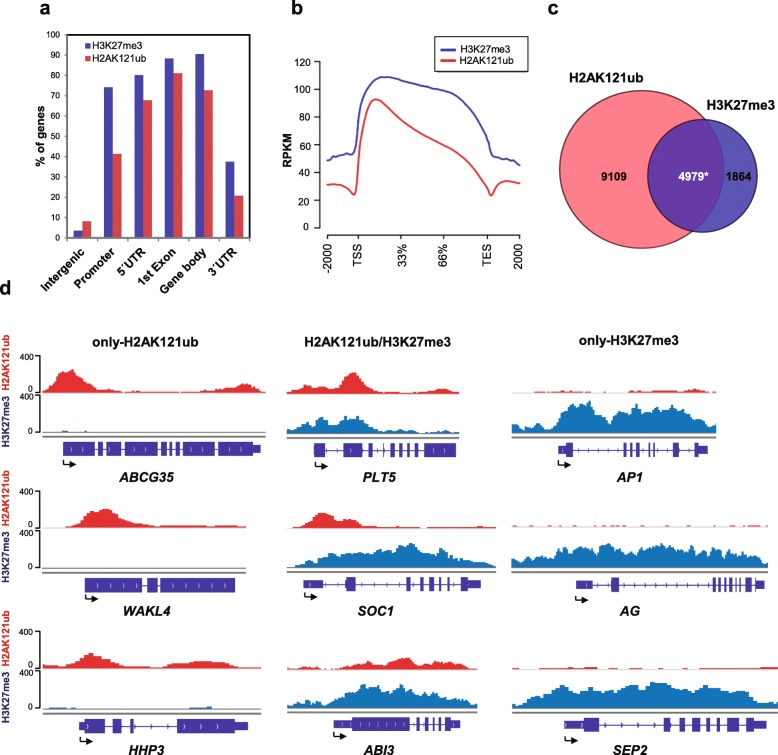
Fig. 1.
Genome-wide occupancy of H2AK121ub and H3K27me3 marks in A. thaliana. a Percentage of genes showing H2AK121ub and H3K27me3 peaks at annotated genic and intergenic regions in the A. thaliana genome. b Metagene plots of H2AK121ub and H3K27me3 coverage at target genes. TES transcription end site, TSS transcription start site. c Overlap between H2AK121ub- and H3K27me3-marked genes in WT at 7 DAG. Asterisk indicates significant overlap with p value <2.2 × 10⁻¹⁶ and odds ratio 1.74 according to Fisher’s exact test. d ChIP-seq genome browser views of H2AK121ub and H3K27me3 occupancy at selected genes. Gene structures and names are shown underneath each panel. Arrows indicate TSSs

