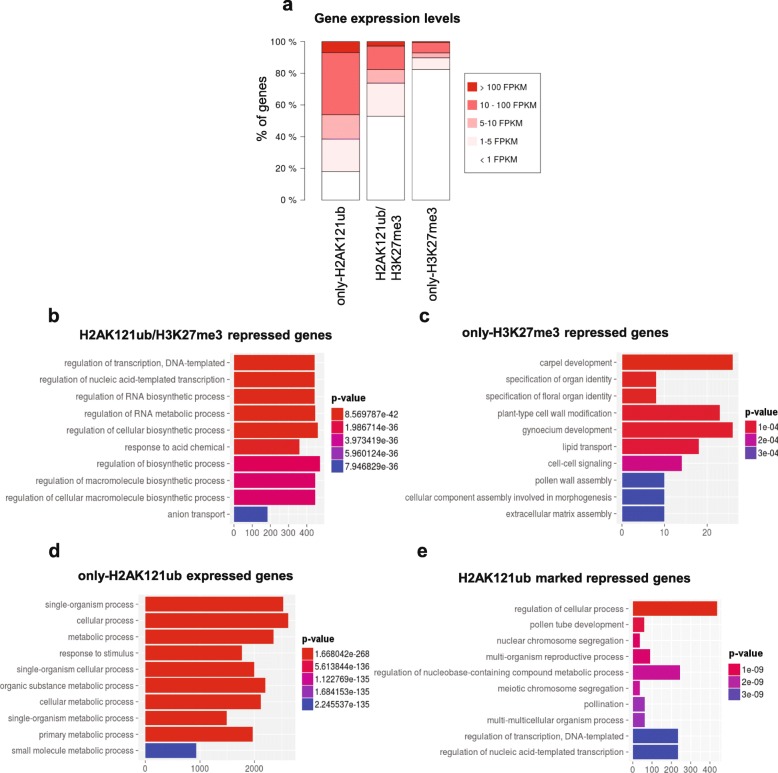
Fig. 2.
Expression levels of differentially marked genes in A. thaliana WT seedlings at 7 DAG. a Percentage of genes belonging to different expression level categories for only-H2AK121ub-, H2AK121ub/H3K27me3-, and only-H3K27me3-marked genes. Expression levels are indicated in fragments per kilobase of exon per million fragments mapped (FPKM). b Gene ontology (GO) enrichment analysis of H2AK121ub/H3K27me3-repressed genes (below 5 FPKM). c GO enrichment analysis of only-H3K27me3-repressed genes. d GO enrichment analysis of only-H2AK121ub-marked expressed genes (at least 5 FPKM). e GO enrichment analysis of onlyH2AK121ub-repressed genes. Distribution of enriched GO terms into the different “biological process” categories as defined by TAIR. P values are indicated by color, the number of genes per category is indicated on the x-axes for b–e

