Fig. 4.
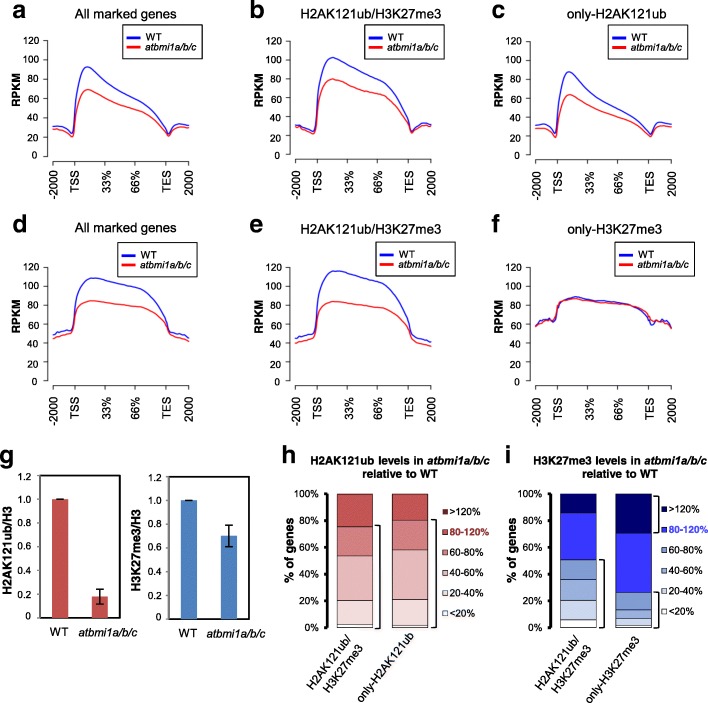
H2AK121ub and H3K27me3 marks are reduced in atbmi1a/b/c mutants. a–c Metagene plot showing H2AK121ub coverage at a all marked genes, b H2AK121ub/H3K27me3-marked genes, and c only-H2AK121ub-marked genes in WT and atbmi1a/b/c mutants. d–f Metagene plot showing H3K27me3 coverage at d all marked genes, e H2AK121ub/H3K27me3-marked genes, and f only-H3K27me3-marked genes in WT and atbmi1a/b/c mutants. g WB quantification of H2AK121ub and H3K27me3 levels normalized to H3 levels in WT and atbmi1a/b/c. Error bars represent standard deviation among at least three biological replicates (see also Additional file 1: Figures S13 and S18). h, i Percentage of genes retaining different levels of h H2AK121ub and i H3K27me3 marks at peaks in atbmi1a/b/c mutants. H2AK121ub levels are indicated by the shade of red and H3K27me3 levels by the shade of blue (80–120% is considered WT levels)

