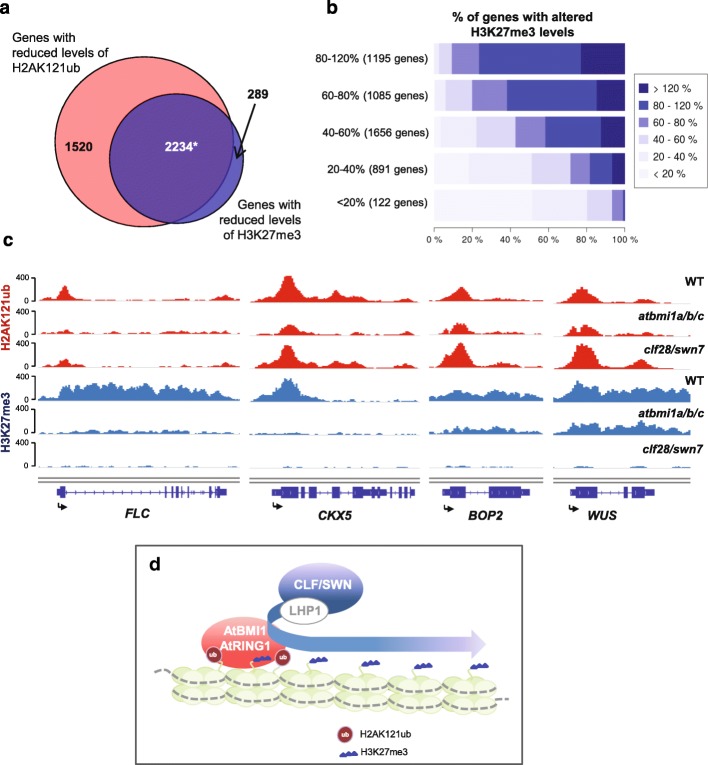
Fig. 5.
Levels of H3K27me3 and H2AK121ub marks are correlated. a Overlap between genes with reduced levels of H2AK121ub and H3K27me3 marks in atbmi1a/b/c mutants (<80% of WT levels). Asterisk indicates significant overlap with p value <2.2 × 10⁻¹⁶ and odds ratio of 7.95 according to Fisher’s exact test. b Correlation of H2AK121ub and H3K27me3 levels in atbmi1a/b/c mutants. H2AK121ub-marked genes were partitioned to consecutive categories ranked by the percentage of H2AK121ub marks at peaks in mutants compared to WT (category on the y-axis). The number of genes in each category is indicated. The x-axis indicates the percentage of genes displaying different changes in H3K27me3 marks. Categories for change in H3K27me3 levels are indicated by the shade of blue. c ChIP-seq genome browser views of H2AK121ub and H3K27me3 levels at different genes in WT, atbmi1a/b/c, and clf28/swn7 mutants. Gene structures and names are shown underneath each panel. Arrows indicate transcription start sites. d Proposed model for a requirement of PRC1 activity to establish H3K27me3 marks at H2AK121ub/H3K27me3 marked genes. Although LHP1 interacts with PRC1, its function is not required for H2AK121 monoubiquitination

