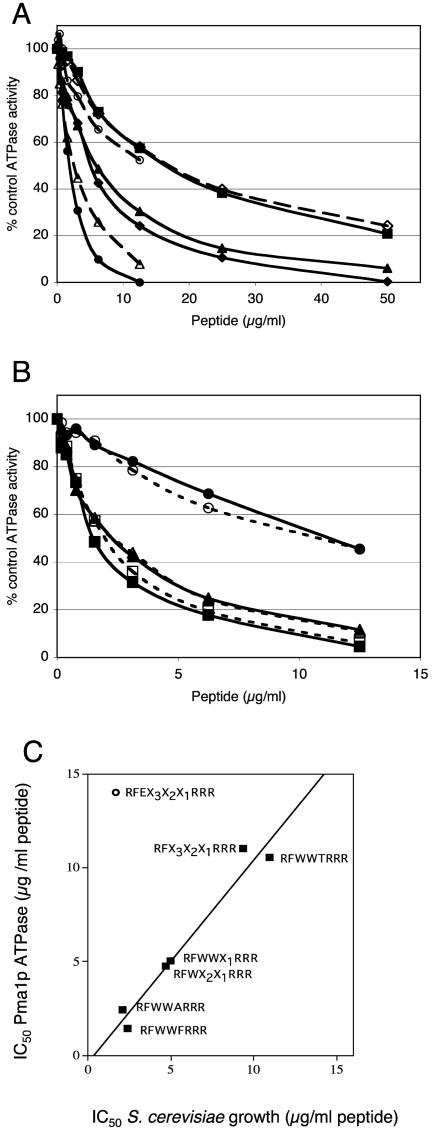
FIG. 2.
Stage 2 to 4 secondary screens of the d-NH2-RFX3X2X1RRR-CONH2 pool, and the relationship between inhibition of growth and Pma1p ATPase activity. (A) The Pma1p ATPase inhibition profiles for plasma membranes from S. cerevisiae strain T48 were measured under conditions of ATP protection, as described in Materials and Methods for selected pools and subpools. Symbols: ▪, d-NH2-RFX3X2X1RRR-CONH2; ▴, d-NH2-RFWX2X1RRR-CONH2; ♦, d-NH2-RFWWX1RRR-CONH2; ⋄, d-NH2-RFEX2X1RRR-CONH2; ○, d-NH2-RFWWTRRR-CONH2; ▵, d-NH2-RFWWARRR-CONH2; •, d-NH2-RFWWFRRR-CONH2. (B) The Pma1p inhibition profiles for the plasma membrane from S. cerevisiae strain T48 were measured in the presence and the absence of ATP protection, as described in Materials and Methods for selected subpools from stage 4 of the deconvolution. Symbols: ▴ and ▵, d-NH2-RFWWARRR-CONH2; ▪ and □, d-NH2-RFWWFRRR-CONH2; • and ○, d-NH2-RFWWTRRR-CONH2; filled lines and symbols, presence of ATP; dashed lines and empty symbols, absence of ATP. (C) The relationships between the IC50 for S. cerevisiae strain T48 and the IC50 for the ATP-protected Pma1p activity for T48 plasma membranes were obtained from the MIC profiles and the data in panels A and B.

