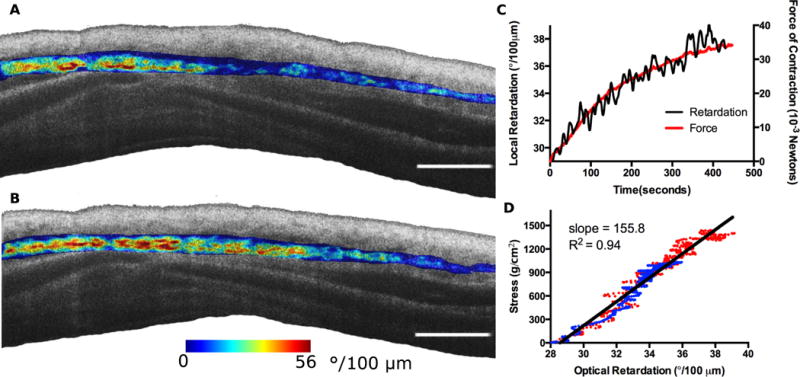
Fig. 5. Stimulated contraction of tracheal smooth muscle strips.

A segment of swine trachea containing the trachealis muscle was dissected and pinned at the cartilage plates to a force transducer just above and below where the muscle connects to the cartilage. Contraction was induced by the application of acetyl methacholine to the epithelial surface of the tracheal segment and mechano-microscopy images were acquired continuously alongside the recorded force data. (A,B) Mechano-microscopy images depicting the local retardation of the segmented muscle overlaid on the structural image. The initial time point, immediately following the application of methacholine (A), is shown along with the time point corresponding to the peak contractile state (B). (C) Time evolution of contraction in terms of force (red, dashed) and local retardation (black, solid). The local retardation data points were obtained by taking the mean local retardation in a given frame of all pixels identified as being smooth muscle. The results were averaged over 5 second intervals. (D) Adjustment of the force curve relative to the estimated muscle volume of the sample. The two plotted datasets (blue and red) correspond to the two samples. Scale bars, 100 μm.
