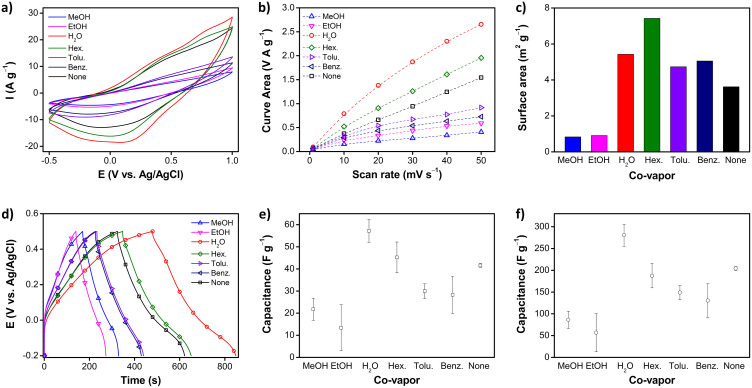
Figure 5.
(a) Cyclic voltammograms of PPCL papers prepared with various co-vapors at a scan rate of 40 mV s−1, and (b) their integrated areas. (c) BET surface areas of PPCL papers prepared with different co-vapors (the BET surface area of only cellulose paper was 12.5 m2 g−1). (d) Charge/discharge curves, and (e) specific discharge capacitances, measured at a current density of 0.1 A g−1. (f) Specific discharge capacitances calculated using the amount of only deposited PPy in (e).

