Figure 7.
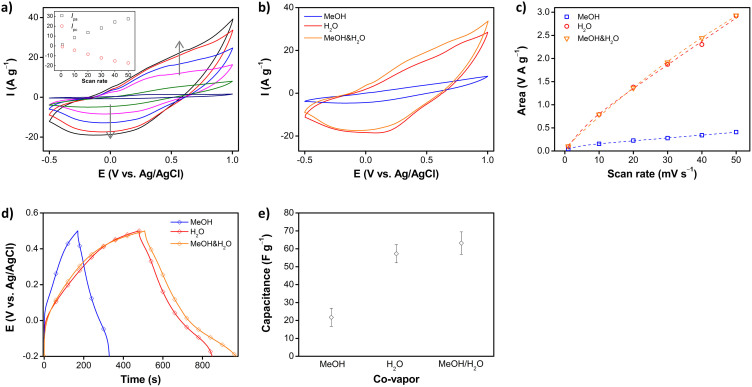
(a) Cyclic voltammograms of PPCL papers prepared with both methanol and water co-vapors (Insets: Plots of the peak current). (b) Representative cyclic voltammograms of PPCL papers prepared with single co-vapor (methanol or water) and mixed co-vapors (methanol and water) at a scan rate of 40 mV s−1, and (c) the calculated curve areas therefrom. (d) Representative charge/discharge curves of PPCL papers prepared with single co-vapor (methanol or water) and mixed co-vapors (methanol and water), at a current density of 0.1 A g−1, and (e) the calculated specific capacitances therefrom.

