FIGURE 3.

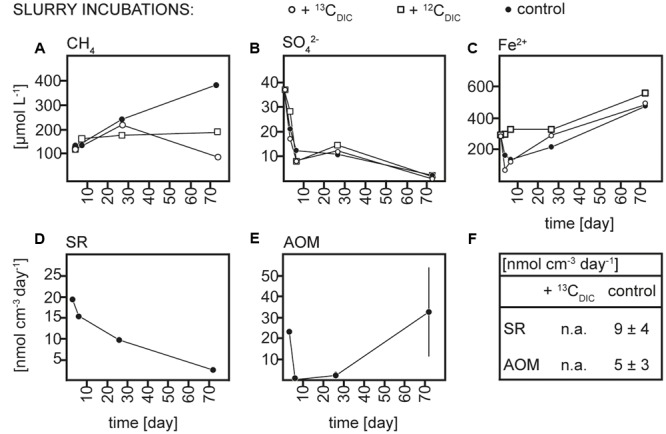
Concentrations over time of (A) methane (CH4), (B) sulfate (SO42-), and (C) dissolved iron (Fe2+), rates over time of (D) sulfate reduction (SR) and (E) anaerobic methane oxidation (AOM) in 13CDIC, 12CDIC and control slurry incubations and (F) average rates of SR and AOM in 13CDIC and control slurry incubations; n.a., not analyzed.
