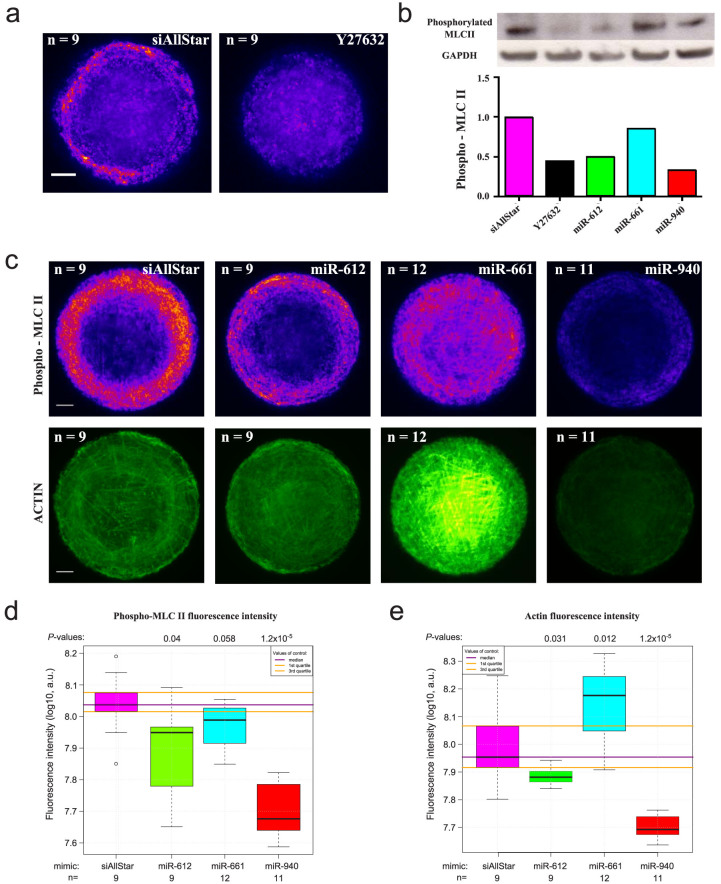
Figure 3. Involvement of miR-661, miR-612 and miR-940 in small GTPase signalling.
(a) Immunostaining of phosphomyosin II and actin filaments of RPE1 cells plated on 500 µm2 circular fibronectin patterns. RPE1 cells were transfected with siRNA-AllStars (siAllStars, negative control) and Y27632 (ROCK inhibitor). They were immunolabeled for phosphomyosin II. Nine different images for each condition were taken, aligned and projected into a single image by using the median value of all images for each pixel (Median Z projection of ImageJ). Rescaled with the same conditions, the images were color-coded with the “fire” look-up table to highlight intensity variations. Scale bar, 5 µm. (b) Western blot of phosphomyosin II. RPE1 cells were lysed and supplemented with protease inhibitor. A total of 10 µg of proteins were deposited and hybridised to MLCII antibodies. GAPDH was used as a loading control. The bar plot shows the GAPDH-normalised signal rescaled to siAllStars. (c) Immunostaining of phosphomyosin II and actin filaments. RPE1 cells were transfected with miR-612, miR-661 or miR-940 mimics and immunolabeled for phosphomyosin II and actin fibres on 1000 µm2 circular fibronectin patterns. For myosin and actin images, 9 to 12 images were taken, aligned and projected into a single image. They were color-coded with the “fire” and “green hot” look-up table to highlight intensity variations for myosin and actin staining, respectively. Scale bar, 5 µm. (d) Log10 of phosphorylated myosin II fluorescence intensity. The integrated fluorescence intensity of myosin was calculated from single images after cell segmentation for each condition. P-values were calculated using the non-parametric two-sided Mann-Whitney test and the number of observations (n) for this calculation. a.u.: arbitrary units. (e) Log10 of actin fluorescence intensity. The integrated fluorescence intensity of actin filaments was calculated from single images after cell segmentation for each condition. P-values are calculated using the non-parametric two sided Mann-Whitney test and the number of observations (n) for this calculation. a.u.: arbitrary units.

