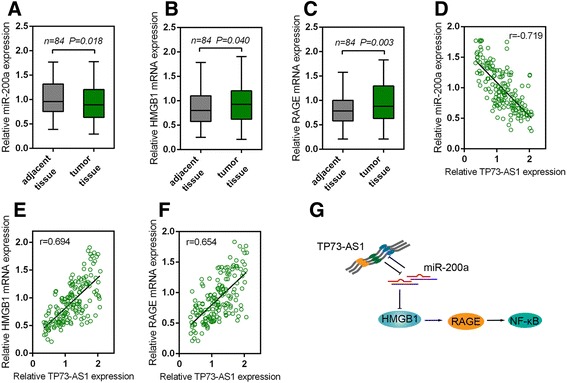
Fig. 6.

The correlation of TP73-AS1 with miR-200a, HMGB1 and RAGE in HCC tissues a, b and c The expression levels of miR-200a, HMGB1 mRNA and RAGE mRNA in 84 paired tumor tissues and adjacent normal tissues were determined by using real-time PCR. The data are presented as mean ± SD of three independent experiments. d, e and f The correlations between TP73-AS1 and miR-200a, HMGB1 and RAGE, respectively, were analyzed by using the Spearman’s rank correlation analysis. g Mechanism diagram of TP73-AS1 modulating HCC cell proliferation through miR-200a-dependent HMGB1/RAGE pathway regulation
