
Fig. 2.
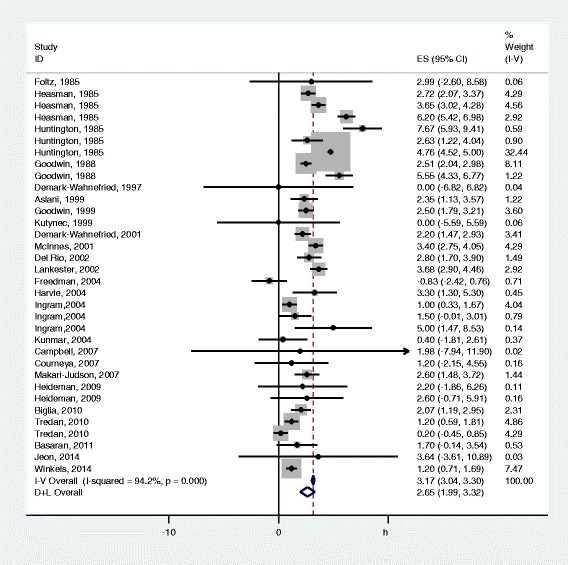
Weight change during chemotherapy for early stage breast cancer. Mean weight changes in individual estimates are depicted as squares with 95% confidence intervals (CI). Pooled estimates with 95% CI are depicted as open diamonds
Official websites use .gov
A
.gov website belongs to an official
government organization in the United States.
Secure .gov websites use HTTPS
A lock (
) or https:// means you've safely
connected to the .gov website. Share sensitive
information only on official, secure websites.
Weight change during chemotherapy for early stage breast cancer. Mean weight changes in individual estimates are depicted as squares with 95% confidence intervals (CI). Pooled estimates with 95% CI are depicted as open diamonds