
Fig. 5.
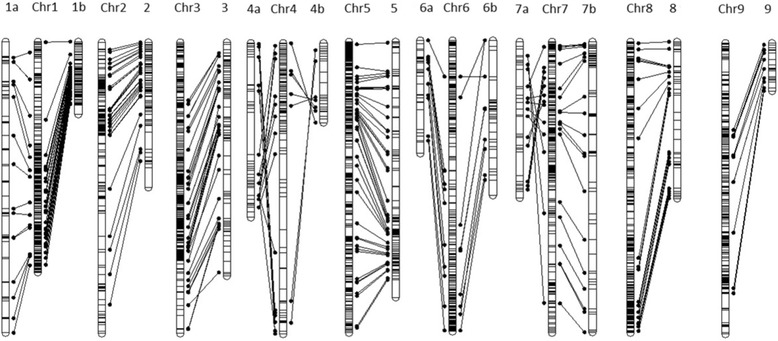
Comparison between the positions of the markers arranged on the linkage groups (LGs) of the integrated map and on the pseudo-chromosomes of C. sinensis (Chr). The LGs in this study are represented by 1a, 1b, 2, 3, 4a, 4b, 5, 6a, 6b, 7a, 7b, 8 and 9. Chr 1, Chr 2, Chr 3, Chr 4, Chr 5, Chr 6, Chr 7, Chr 8, and Chr 9 represent the chromosomes of the C. sinensis genome. The horizontal lines linking the groups and chromosomes represent the ordering and collinearity of the markers anchored on the map with the sequences of the genome