Fig. 3.
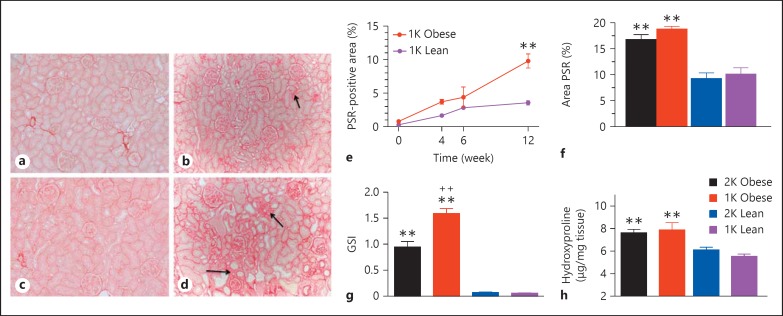
Fibrotic changes in kidneys of male ZSF-1 rats. PSR staining of kidney tissues from 1K-lean rats at baseline (a) and 24 weeks after surgery (b). Representative PSR staining of kidney tissues from 1K-obese rats at baseline (c) and 24 weeks after surgery (d). Representative fibrotic areas in the TI are marked with arrows in (b) and (d). e Time-dependent changes in percentile PSR-positive area in the TI space of kidneys from the 12-week study with 1K ZSF-1 rats. f Percentage of PSR positive area in the TI space from the 24-week study demonstrated elevation in the 1K- and 2K-obese rats. g Increased GSI in 1K- and 2K-obese rats relative to lean controls from the 24-week study. h Hydroxyproline content of renal cortex was also elevated in the obese rats from the 24-week study, which was normalized by tissue weight. All bar graphs share the legend as shown in (h). ** p < 0.01 vs. respective lean rats; ++ p < 0.01 for 1K- vs. 2K-obese rats.

