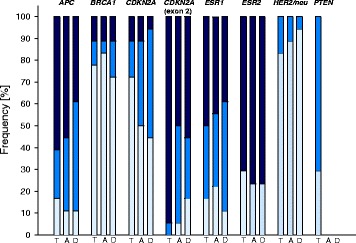
Fig. 3.

Frequency of gene-specific DNA methylation in tumor (T), tumor-adjacent (A) and tumor-distant (D) tissues. Light blue: methylation status < LOD, middle blue: methylation status < LOQ, dark blue: methylation status ≥ LOQ. LODs and LOQs of MS-HRM assays for APC, BRCA1, CDKN2A, ESR1, HER2/neu and PTEN are given in Table 2. The LOQ of the PSQ assay for ESR2 is 5%. Due to the low LOD and LOQ of the assay for PTEN and the low frequency of methylation in tumors, tumor-adjacent and tumor distant-tissues were analyzed only randomly
